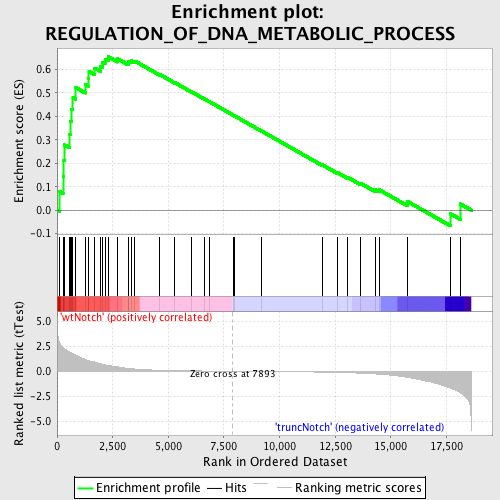
Profile of the Running ES Score & Positions of GeneSet Members on the Rank Ordered List
| Dataset | Set_03_truncNotch_versus_wtNotch.phenotype_truncNotch_versus_wtNotch.cls #wtNotch_versus_truncNotch.phenotype_truncNotch_versus_wtNotch.cls #wtNotch_versus_truncNotch_repos |
| Phenotype | phenotype_truncNotch_versus_wtNotch.cls#wtNotch_versus_truncNotch_repos |
| Upregulated in class | wtNotch |
| GeneSet | REGULATION_OF_DNA_METABOLIC_PROCESS |
| Enrichment Score (ES) | 0.65368915 |
| Normalized Enrichment Score (NES) | 1.6843426 |
| Nominal p-value | 0.0 |
| FDR q-value | 0.24367128 |
| FWER p-Value | 0.702 |
| PROBE | DESCRIPTION (from dataset) | GENE SYMBOL | GENE_TITLE | RANK IN GENE LIST | RANK METRIC SCORE | RUNNING ES | CORE ENRICHMENT | |
|---|---|---|---|---|---|---|---|---|
| 1 | KPNA2 | 3450114 | 125 | 2.781 | 0.0781 | Yes | ||
| 2 | GTPBP4 | 6840332 | 269 | 2.393 | 0.1434 | Yes | ||
| 3 | KPNA1 | 5270324 | 304 | 2.308 | 0.2120 | Yes | ||
| 4 | POLH | 2690528 | 340 | 2.230 | 0.2781 | Yes | ||
| 5 | TLK1 | 7100605 | 567 | 1.887 | 0.3235 | Yes | ||
| 6 | SMARCAD1 | 5390619 | 589 | 1.868 | 0.3793 | Yes | ||
| 7 | TERF2 | 3840044 | 652 | 1.793 | 0.4307 | Yes | ||
| 8 | TLK2 | 1170161 | 713 | 1.733 | 0.4804 | Yes | ||
| 9 | ATR | 6860273 | 844 | 1.606 | 0.5224 | Yes | ||
| 10 | CDT1 | 3780682 | 1268 | 1.186 | 0.5358 | Yes | ||
| 11 | ERCC4 | 1570619 5720180 | 1393 | 1.079 | 0.5620 | Yes | ||
| 12 | TIPIN | 1570301 2480113 | 1432 | 1.048 | 0.5919 | Yes | ||
| 13 | GMNN | 2630148 | 1691 | 0.916 | 0.6060 | Yes | ||
| 14 | MRE11A | 3850601 4670332 | 1958 | 0.748 | 0.6145 | Yes | ||
| 15 | CDC45L | 70537 3130114 | 2050 | 0.690 | 0.6306 | Yes | ||
| 16 | CDC6 | 4570296 5360600 | 2159 | 0.641 | 0.6444 | Yes | ||
| 17 | RAD50 | 4050184 6770746 | 2314 | 0.577 | 0.6537 | Yes | ||
| 18 | TERF2IP | 580010 870364 2190358 | 2723 | 0.433 | 0.6449 | No | ||
| 19 | RAD17 | 5220739 | 3194 | 0.288 | 0.6284 | No | ||
| 20 | CDK2 | 130484 2260301 4010088 5050110 | 3216 | 0.284 | 0.6359 | No | ||
| 21 | IL7R | 2060088 6380500 | 3351 | 0.254 | 0.6365 | No | ||
| 22 | RAD51 | 6110450 6980280 | 3499 | 0.225 | 0.6354 | No | ||
| 23 | PPARGC1A | 4670040 | 4621 | 0.094 | 0.5780 | No | ||
| 24 | NBN | 730538 2470619 4780594 | 5294 | 0.060 | 0.5436 | No | ||
| 25 | NF2 | 4150735 6450139 | 6028 | 0.036 | 0.5053 | No | ||
| 26 | GLI1 | 4560176 | 6636 | 0.022 | 0.4733 | No | ||
| 27 | RAD9A | 110300 1940632 3990390 6040014 | 6846 | 0.018 | 0.4626 | No | ||
| 28 | EREG | 50519 4920129 | 7933 | -0.001 | 0.4041 | No | ||
| 29 | WRNIP1 | 2320541 5890725 | 7969 | -0.001 | 0.4023 | No | ||
| 30 | SET | 6650286 | 9170 | -0.021 | 0.3384 | No | ||
| 31 | UBE2V2 | 4210484 | 11909 | -0.087 | 0.1936 | No | ||
| 32 | IL4 | 6020537 | 12614 | -0.119 | 0.1594 | No | ||
| 33 | UBE2N | 520369 2900047 | 13033 | -0.144 | 0.1413 | No | ||
| 34 | S100A11 | 2260064 | 13646 | -0.194 | 0.1143 | No | ||
| 35 | GLI2 | 3060632 | 14306 | -0.270 | 0.0870 | No | ||
| 36 | UBE2V1 | 2470093 | 14474 | -0.295 | 0.0870 | No | ||
| 37 | TGFB1 | 1940162 | 15749 | -0.610 | 0.0370 | No | ||
| 38 | TNFSF13 | 2650170 | 17689 | -1.692 | -0.0157 | No | ||
| 39 | ERCC1 | 3800010 4590132 4670397 | 18123 | -2.149 | 0.0265 | No |

