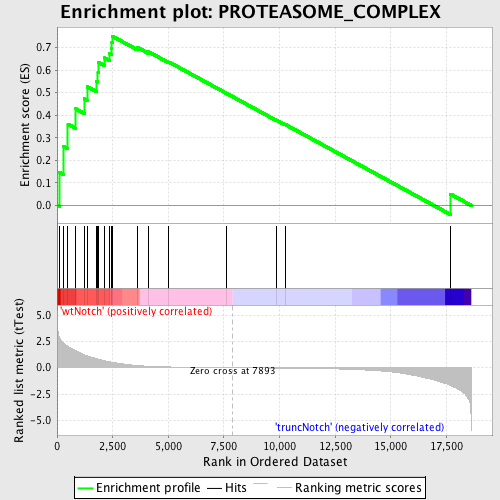
Profile of the Running ES Score & Positions of GeneSet Members on the Rank Ordered List
| Dataset | Set_03_truncNotch_versus_wtNotch.phenotype_truncNotch_versus_wtNotch.cls #wtNotch_versus_truncNotch.phenotype_truncNotch_versus_wtNotch.cls #wtNotch_versus_truncNotch_repos |
| Phenotype | phenotype_truncNotch_versus_wtNotch.cls#wtNotch_versus_truncNotch_repos |
| Upregulated in class | wtNotch |
| GeneSet | PROTEASOME_COMPLEX |
| Enrichment Score (ES) | 0.75054044 |
| Normalized Enrichment Score (NES) | 1.6835096 |
| Nominal p-value | 0.0125 |
| FDR q-value | 0.21182749 |
| FWER p-Value | 0.708 |
| PROBE | DESCRIPTION (from dataset) | GENE SYMBOL | GENE_TITLE | RANK IN GENE LIST | RANK METRIC SCORE | RUNNING ES | CORE ENRICHMENT | |
|---|---|---|---|---|---|---|---|---|
| 1 | PSMD14 | 5690593 | 119 | 2.806 | 0.1452 | Yes | ||
| 2 | PSMD7 | 2030619 6220594 | 293 | 2.337 | 0.2621 | Yes | ||
| 3 | PSMD12 | 730044 | 488 | 2.007 | 0.3600 | Yes | ||
| 4 | PSMD10 | 520494 1170576 3830050 | 842 | 1.611 | 0.4280 | Yes | ||
| 5 | PSMD4 | 430068 | 1236 | 1.214 | 0.4725 | Yes | ||
| 6 | ADRM1 | 670333 5690162 | 1350 | 1.114 | 0.5266 | Yes | ||
| 7 | SHFM1 | 1570114 | 1773 | 0.860 | 0.5504 | Yes | ||
| 8 | PSME1 | 450193 4480035 | 1836 | 0.823 | 0.5915 | Yes | ||
| 9 | PSMD3 | 1400647 | 1854 | 0.811 | 0.6343 | Yes | ||
| 10 | PSMC5 | 2760315 6550021 | 2143 | 0.650 | 0.6539 | Yes | ||
| 11 | PSMC6 | 2810021 | 2356 | 0.560 | 0.6728 | Yes | ||
| 12 | PSME2 | 4850086 | 2451 | 0.523 | 0.6960 | Yes | ||
| 13 | PSMC4 | 580050 1580025 | 2463 | 0.518 | 0.7233 | Yes | ||
| 14 | PSME3 | 2810537 | 2475 | 0.515 | 0.7505 | Yes | ||
| 15 | PSMD13 | 3450603 6550672 | 3610 | 0.203 | 0.7005 | No | ||
| 16 | PSMC2 | 7040010 | 4109 | 0.135 | 0.6811 | No | ||
| 17 | PSMD11 | 2340538 6510053 | 5028 | 0.072 | 0.6356 | No | ||
| 18 | PSMD8 | 630142 | 7603 | 0.005 | 0.4974 | No | ||
| 19 | PSMD5 | 3940139 4570041 | 9847 | -0.033 | 0.3786 | No | ||
| 20 | PSMC3 | 2480184 | 10249 | -0.041 | 0.3592 | No | ||
| 21 | PSMD2 | 4670706 5050364 | 17675 | -1.679 | 0.0506 | No |

