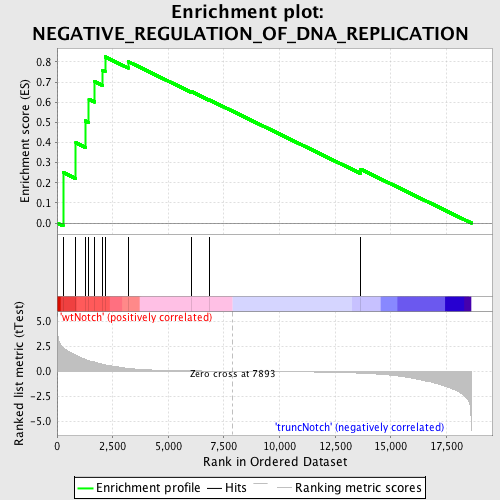
Profile of the Running ES Score & Positions of GeneSet Members on the Rank Ordered List
| Dataset | Set_03_truncNotch_versus_wtNotch.phenotype_truncNotch_versus_wtNotch.cls #wtNotch_versus_truncNotch.phenotype_truncNotch_versus_wtNotch.cls #wtNotch_versus_truncNotch_repos |
| Phenotype | phenotype_truncNotch_versus_wtNotch.cls#wtNotch_versus_truncNotch_repos |
| Upregulated in class | wtNotch |
| GeneSet | NEGATIVE_REGULATION_OF_DNA_REPLICATION |
| Enrichment Score (ES) | 0.8248927 |
| Normalized Enrichment Score (NES) | 1.5808271 |
| Nominal p-value | 0.011415525 |
| FDR q-value | 0.30984586 |
| FWER p-Value | 0.99 |
| PROBE | DESCRIPTION (from dataset) | GENE SYMBOL | GENE_TITLE | RANK IN GENE LIST | RANK METRIC SCORE | RUNNING ES | CORE ENRICHMENT | |
|---|---|---|---|---|---|---|---|---|
| 1 | GTPBP4 | 6840332 | 269 | 2.393 | 0.2510 | Yes | ||
| 2 | ATR | 6860273 | 844 | 1.606 | 0.3983 | Yes | ||
| 3 | CDT1 | 3780682 | 1268 | 1.186 | 0.5071 | Yes | ||
| 4 | TIPIN | 1570301 2480113 | 1432 | 1.048 | 0.6145 | Yes | ||
| 5 | GMNN | 2630148 | 1691 | 0.916 | 0.7023 | Yes | ||
| 6 | CDC45L | 70537 3130114 | 2050 | 0.690 | 0.7596 | Yes | ||
| 7 | CDC6 | 4570296 5360600 | 2159 | 0.641 | 0.8249 | Yes | ||
| 8 | RAD17 | 5220739 | 3194 | 0.288 | 0.8012 | No | ||
| 9 | NF2 | 4150735 6450139 | 6028 | 0.036 | 0.6529 | No | ||
| 10 | RAD9A | 110300 1940632 3990390 6040014 | 6846 | 0.018 | 0.6110 | No | ||
| 11 | S100A11 | 2260064 | 13646 | -0.194 | 0.2671 | No |

