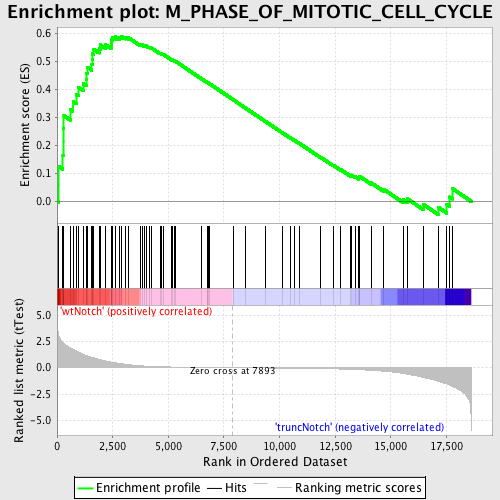
Profile of the Running ES Score & Positions of GeneSet Members on the Rank Ordered List
| Dataset | Set_03_truncNotch_versus_wtNotch.phenotype_truncNotch_versus_wtNotch.cls #wtNotch_versus_truncNotch.phenotype_truncNotch_versus_wtNotch.cls #wtNotch_versus_truncNotch_repos |
| Phenotype | phenotype_truncNotch_versus_wtNotch.cls#wtNotch_versus_truncNotch_repos |
| Upregulated in class | wtNotch |
| GeneSet | M_PHASE_OF_MITOTIC_CELL_CYCLE |
| Enrichment Score (ES) | 0.58963305 |
| Normalized Enrichment Score (NES) | 1.6509761 |
| Nominal p-value | 0.0 |
| FDR q-value | 0.27193272 |
| FWER p-Value | 0.859 |
| PROBE | DESCRIPTION (from dataset) | GENE SYMBOL | GENE_TITLE | RANK IN GENE LIST | RANK METRIC SCORE | RUNNING ES | CORE ENRICHMENT | |
|---|---|---|---|---|---|---|---|---|
| 1 | NCAPH | 6220435 | 56 | 3.183 | 0.0617 | Yes | ||
| 2 | AKAP8 | 4210026 | 57 | 3.171 | 0.1261 | Yes | ||
| 3 | BUB1B | 1450288 | 261 | 2.413 | 0.1642 | Yes | ||
| 4 | ANAPC4 | 4540338 | 272 | 2.384 | 0.2122 | Yes | ||
| 5 | MAD2L1 | 4480725 | 273 | 2.379 | 0.2605 | Yes | ||
| 6 | TPX2 | 6420324 | 306 | 2.306 | 0.3057 | Yes | ||
| 7 | ANAPC5 | 730164 7100685 | 597 | 1.862 | 0.3279 | Yes | ||
| 8 | NUSAP1 | 940048 3120435 | 714 | 1.733 | 0.3568 | Yes | ||
| 9 | NDC80 | 4120465 | 867 | 1.583 | 0.3808 | Yes | ||
| 10 | ZWINT | 6940670 | 954 | 1.481 | 0.4063 | Yes | ||
| 11 | MPHOSPH6 | 5570164 | 1179 | 1.259 | 0.4198 | Yes | ||
| 12 | AURKA | 780537 | 1317 | 1.140 | 0.4356 | Yes | ||
| 13 | SMC1A | 3060600 5700148 5890113 6370154 | 1333 | 1.130 | 0.4577 | Yes | ||
| 14 | ZW10 | 2900735 3520687 | 1362 | 1.103 | 0.4786 | Yes | ||
| 15 | PCBP4 | 6350722 | 1563 | 0.991 | 0.4880 | Yes | ||
| 16 | CD28 | 1400739 4210093 | 1578 | 0.983 | 0.5072 | Yes | ||
| 17 | CDC16 | 1940706 | 1589 | 0.980 | 0.5266 | Yes | ||
| 18 | KNTC1 | 430079 | 1652 | 0.940 | 0.5424 | Yes | ||
| 19 | BIRC5 | 110408 580014 1770632 | 1894 | 0.790 | 0.5454 | Yes | ||
| 20 | DLG7 | 3120041 | 1942 | 0.763 | 0.5584 | Yes | ||
| 21 | CCNA2 | 5290075 | 2176 | 0.634 | 0.5587 | Yes | ||
| 22 | SUGT1 | 1690670 | 2430 | 0.532 | 0.5559 | Yes | ||
| 23 | CIT | 2370601 | 2435 | 0.528 | 0.5664 | Yes | ||
| 24 | SMC4 | 5910240 | 2448 | 0.524 | 0.5764 | Yes | ||
| 25 | EGF | 5220154 | 2474 | 0.515 | 0.5855 | Yes | ||
| 26 | SSSCA1 | 1240402 780309 | 2608 | 0.469 | 0.5879 | Yes | ||
| 27 | PPP5C | 3130047 | 2795 | 0.409 | 0.5862 | Yes | ||
| 28 | NOLC1 | 2350195 | 2875 | 0.381 | 0.5896 | Yes | ||
| 29 | KIF22 | 1190368 | 3067 | 0.321 | 0.5859 | No | ||
| 30 | RAD17 | 5220739 | 3194 | 0.288 | 0.5849 | No | ||
| 31 | PIN1 | 2970408 | 3758 | 0.180 | 0.5582 | No | ||
| 32 | TGFA | 1570332 | 3820 | 0.172 | 0.5584 | No | ||
| 33 | SMC3 | 870546 1400411 5700039 6450577 | 3910 | 0.158 | 0.5568 | No | ||
| 34 | NPM2 | 6040139 | 4003 | 0.148 | 0.5549 | No | ||
| 35 | DDX11 | 6590671 | 4135 | 0.133 | 0.5505 | No | ||
| 36 | CDC25C | 2570673 4760161 6520707 | 4241 | 0.124 | 0.5474 | No | ||
| 37 | PML | 50093 2190435 2450402 3840082 | 4633 | 0.093 | 0.5282 | No | ||
| 38 | ATM | 3610110 4050524 | 4686 | 0.090 | 0.5272 | No | ||
| 39 | DCTN3 | 6840131 | 4767 | 0.085 | 0.5246 | No | ||
| 40 | CDC23 | 3190593 | 5157 | 0.066 | 0.5050 | No | ||
| 41 | KIF15 | 610731 4070731 6520014 | 5200 | 0.064 | 0.5040 | No | ||
| 42 | NBN | 730538 2470619 4780594 | 5294 | 0.060 | 0.5002 | No | ||
| 43 | EPGN | 6980450 | 5333 | 0.059 | 0.4994 | No | ||
| 44 | TTK | 3800129 | 6467 | 0.026 | 0.4388 | No | ||
| 45 | PAM | 5290528 | 6751 | 0.020 | 0.4239 | No | ||
| 46 | ANAPC10 | 870086 1170037 2260129 | 6773 | 0.019 | 0.4232 | No | ||
| 47 | RAN | 2260446 4590647 | 6789 | 0.019 | 0.4228 | No | ||
| 48 | KIF2C | 6940082 | 6866 | 0.018 | 0.4190 | No | ||
| 49 | EREG | 50519 4920129 | 7933 | -0.001 | 0.3616 | No | ||
| 50 | BUB1 | 5390270 | 8457 | -0.009 | 0.3336 | No | ||
| 51 | KIF11 | 5390139 | 9371 | -0.025 | 0.2848 | No | ||
| 52 | TTN | 2320161 4670056 6550026 | 10145 | -0.039 | 0.2439 | No | ||
| 53 | PRMT5 | 2760180 4590072 | 10509 | -0.047 | 0.2253 | No | ||
| 54 | CETN1 | 6020056 | 10660 | -0.050 | 0.2182 | No | ||
| 55 | NEK2 | 2120520 | 10893 | -0.056 | 0.2069 | No | ||
| 56 | CLIP1 | 2850162 6770397 | 11827 | -0.084 | 0.1583 | No | ||
| 57 | NEK6 | 3360687 | 12419 | -0.109 | 0.1286 | No | ||
| 58 | CENPE | 2850022 | 12747 | -0.126 | 0.1135 | No | ||
| 59 | CDCA5 | 5670131 | 13200 | -0.156 | 0.0923 | No | ||
| 60 | PLK1 | 1780369 2640121 | 13227 | -0.159 | 0.0942 | No | ||
| 61 | UBE2C | 6130017 | 13412 | -0.173 | 0.0877 | No | ||
| 62 | ANLN | 1780113 2470537 6840047 | 13567 | -0.187 | 0.0832 | No | ||
| 63 | CDKN2B | 6020040 | 13572 | -0.187 | 0.0868 | No | ||
| 64 | ANAPC11 | 1780601 | 13588 | -0.189 | 0.0898 | No | ||
| 65 | RCC1 | 2480358 | 14128 | -0.246 | 0.0658 | No | ||
| 66 | DCTN2 | 540471 3780717 | 14688 | -0.333 | 0.0424 | No | ||
| 67 | NUMA1 | 6520576 | 15578 | -0.548 | 0.0056 | No | ||
| 68 | TGFB1 | 1940162 | 15749 | -0.610 | 0.0088 | No | ||
| 69 | TARDBP | 870390 2350093 | 16452 | -0.917 | -0.0104 | No | ||
| 70 | CHFR | 3390050 6450300 6450736 | 17127 | -1.272 | -0.0209 | No | ||
| 71 | CDC25B | 6940102 | 17519 | -1.538 | -0.0107 | No | ||
| 72 | CHMP1A | 5550441 | 17651 | -1.647 | 0.0157 | No | ||
| 73 | MAD2L2 | 1240358 | 17788 | -1.784 | 0.0447 | No |

