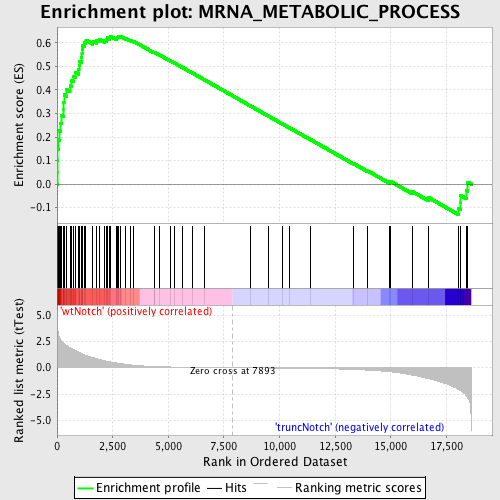
Profile of the Running ES Score & Positions of GeneSet Members on the Rank Ordered List
| Dataset | Set_03_truncNotch_versus_wtNotch.phenotype_truncNotch_versus_wtNotch.cls #wtNotch_versus_truncNotch.phenotype_truncNotch_versus_wtNotch.cls #wtNotch_versus_truncNotch_repos |
| Phenotype | phenotype_truncNotch_versus_wtNotch.cls#wtNotch_versus_truncNotch_repos |
| Upregulated in class | wtNotch |
| GeneSet | MRNA_METABOLIC_PROCESS |
| Enrichment Score (ES) | 0.62893254 |
| Normalized Enrichment Score (NES) | 1.7308733 |
| Nominal p-value | 0.0 |
| FDR q-value | 0.32113856 |
| FWER p-Value | 0.413 |
| PROBE | DESCRIPTION (from dataset) | GENE SYMBOL | GENE_TITLE | RANK IN GENE LIST | RANK METRIC SCORE | RUNNING ES | CORE ENRICHMENT | |
|---|---|---|---|---|---|---|---|---|
| 1 | SFRS1 | 2360440 | 15 | 3.775 | 0.0504 | Yes | ||
| 2 | SFRS6 | 60224 | 18 | 3.719 | 0.1006 | Yes | ||
| 3 | CSTF2 | 6040463 | 33 | 3.529 | 0.1477 | Yes | ||
| 4 | SFPQ | 4760110 | 60 | 3.132 | 0.1888 | Yes | ||
| 5 | CSTF3 | 3850156 5570458 | 92 | 2.902 | 0.2264 | Yes | ||
| 6 | DDX20 | 3290348 | 162 | 2.649 | 0.2586 | Yes | ||
| 7 | GRSF1 | 2100184 | 195 | 2.543 | 0.2914 | Yes | ||
| 8 | KIN | 6550014 | 300 | 2.324 | 0.3173 | Yes | ||
| 9 | CDC2L2 | 1400671 5290168 | 303 | 2.315 | 0.3485 | Yes | ||
| 10 | SF3A3 | 6660603 | 313 | 2.281 | 0.3790 | Yes | ||
| 11 | DHX15 | 870632 | 428 | 2.087 | 0.4011 | Yes | ||
| 12 | SRPK2 | 6380341 | 580 | 1.872 | 0.4183 | Yes | ||
| 13 | UPF2 | 4810471 | 654 | 1.793 | 0.4387 | Yes | ||
| 14 | SPOP | 450035 | 740 | 1.710 | 0.4573 | Yes | ||
| 15 | PAIP1 | 3870576 | 825 | 1.625 | 0.4748 | Yes | ||
| 16 | DHX38 | 780243 | 960 | 1.474 | 0.4875 | Yes | ||
| 17 | SF3B3 | 3710044 | 985 | 1.449 | 0.5059 | Yes | ||
| 18 | GSPT1 | 5420050 | 1023 | 1.408 | 0.5230 | Yes | ||
| 19 | RNMT | 1770500 | 1109 | 1.327 | 0.5364 | Yes | ||
| 20 | SFRS2IP | 730687 1500373 | 1117 | 1.317 | 0.5538 | Yes | ||
| 21 | CPSF1 | 6290064 | 1124 | 1.314 | 0.5713 | Yes | ||
| 22 | PHF5A | 2690519 | 1145 | 1.284 | 0.5876 | Yes | ||
| 23 | SFRS7 | 2760408 | 1222 | 1.224 | 0.6001 | Yes | ||
| 24 | KHDRBS1 | 1240403 6040040 | 1297 | 1.152 | 0.6118 | Yes | ||
| 25 | SF3A1 | 1580315 | 1611 | 0.970 | 0.6080 | Yes | ||
| 26 | USP39 | 1090242 3520435 4760736 | 1771 | 0.862 | 0.6111 | Yes | ||
| 27 | CSTF1 | 4610129 | 1885 | 0.795 | 0.6158 | Yes | ||
| 28 | SNRPD1 | 4480162 | 2134 | 0.653 | 0.6113 | Yes | ||
| 29 | CRNKL1 | 5050097 | 2236 | 0.607 | 0.6141 | Yes | ||
| 30 | FUSIP1 | 520082 5390114 | 2247 | 0.602 | 0.6217 | Yes | ||
| 31 | EFTUD2 | 2470707 4610148 | 2369 | 0.554 | 0.6227 | Yes | ||
| 32 | SMG6 | 5820243 | 2392 | 0.547 | 0.6289 | Yes | ||
| 33 | SIP1 | 2640706 | 2656 | 0.456 | 0.6209 | No | ||
| 34 | SNW1 | 4010736 | 2694 | 0.442 | 0.6249 | No | ||
| 35 | DDX39 | 3840148 | 2759 | 0.421 | 0.6272 | No | ||
| 36 | SFRS10 | 6130528 6400438 7040112 | 2861 | 0.384 | 0.6269 | No | ||
| 37 | PTBP1 | 4070736 | 3078 | 0.319 | 0.6196 | No | ||
| 38 | PABPC1 | 2650180 2690253 6020632 1990270 | 3292 | 0.268 | 0.6118 | No | ||
| 39 | SFRS8 | 5130162 5700164 | 3439 | 0.235 | 0.6071 | No | ||
| 40 | NONO | 7050014 | 4355 | 0.114 | 0.5593 | No | ||
| 41 | SFRS9 | 3800047 | 4373 | 0.112 | 0.5599 | No | ||
| 42 | PPARGC1A | 4670040 | 4621 | 0.094 | 0.5479 | No | ||
| 43 | SLBP | 6220601 | 5075 | 0.069 | 0.5244 | No | ||
| 44 | PRPF31 | 6100360 | 5266 | 0.061 | 0.5150 | No | ||
| 45 | GEMIN5 | 3120577 | 5648 | 0.047 | 0.4951 | No | ||
| 46 | CPSF3 | 2480671 | 6101 | 0.034 | 0.4712 | No | ||
| 47 | AUH | 5570152 | 6633 | 0.022 | 0.4429 | No | ||
| 48 | LSM5 | 4540398 | 8681 | -0.013 | 0.3328 | No | ||
| 49 | GEMIN6 | 2120288 3830176 | 9521 | -0.027 | 0.2879 | No | ||
| 50 | SSB | 460286 3140717 | 10136 | -0.039 | 0.2553 | No | ||
| 51 | RNGTT | 780152 780746 1090471 | 10447 | -0.045 | 0.2392 | No | ||
| 52 | SRPK1 | 450110 | 11411 | -0.070 | 0.1883 | No | ||
| 53 | CUGBP1 | 450292 510022 7050176 7050215 | 13322 | -0.166 | 0.0876 | No | ||
| 54 | SFRS5 | 3450176 6350008 | 13966 | -0.228 | 0.0560 | No | ||
| 55 | ELAVL4 | 50735 3360086 5220167 | 14942 | -0.381 | 0.0086 | No | ||
| 56 | TXNL4A | 4120286 6510242 | 14992 | -0.391 | 0.0113 | No | ||
| 57 | NUDT21 | 1240167 | 15966 | -0.696 | -0.0317 | No | ||
| 58 | LSM3 | 780164 | 16698 | -1.021 | -0.0573 | No | ||
| 59 | SNRPD2 | 6110035 | 18030 | -2.033 | -0.1015 | No | ||
| 60 | SF3A2 | 3140500 | 18131 | -2.158 | -0.0776 | No | ||
| 61 | ZFP36 | 2030605 | 18134 | -2.159 | -0.0484 | No | ||
| 62 | GEMIN7 | 2320433 | 18398 | -2.656 | -0.0266 | No | ||
| 63 | SFRS2 | 50707 380593 | 18457 | -2.828 | 0.0086 | No |

