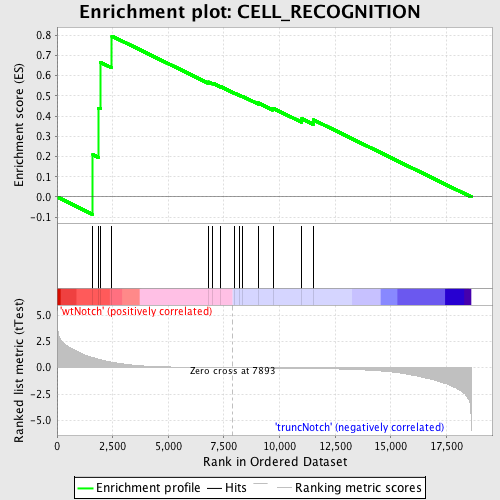
Profile of the Running ES Score & Positions of GeneSet Members on the Rank Ordered List
| Dataset | Set_03_truncNotch_versus_wtNotch.phenotype_truncNotch_versus_wtNotch.cls #wtNotch_versus_truncNotch.phenotype_truncNotch_versus_wtNotch.cls #wtNotch_versus_truncNotch_repos |
| Phenotype | phenotype_truncNotch_versus_wtNotch.cls#wtNotch_versus_truncNotch_repos |
| Upregulated in class | wtNotch |
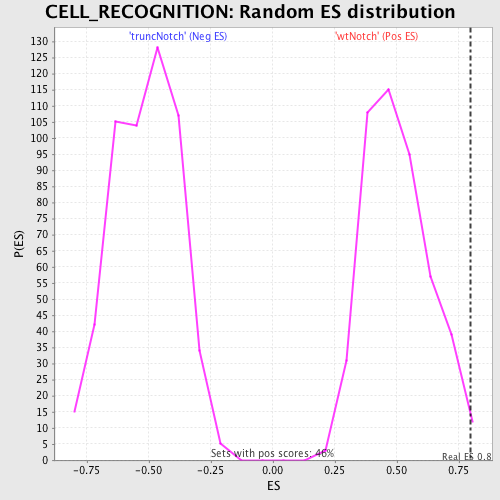
| GeneSet | CELL_RECOGNITION |
| Enrichment Score (ES) | 0.7952635 |
| Normalized Enrichment Score (NES) | 1.5888525 |
| Nominal p-value | 0.008695652 |
| FDR q-value | 0.31148598 |
| FWER p-Value | 0.987 |
| PROBE | DESCRIPTION (from dataset) | GENE SYMBOL | GENE_TITLE | RANK IN GENE LIST | RANK METRIC SCORE | RUNNING ES | CORE ENRICHMENT | |
|---|---|---|---|---|---|---|---|---|
| 1 | PECAM1 | 4810139 | 1608 | 0.972 | 0.2088 | Yes | ||
| 2 | CADM1 | 6620128 | 1864 | 0.806 | 0.4399 | Yes | ||
| 3 | CDK5R1 | 3870161 | 1949 | 0.758 | 0.6656 | Yes | ||
| 4 | AMIGO1 | 6180215 | 2464 | 0.518 | 0.7953 | Yes | ||
| 5 | SPAM1 | 4480398 | 6790 | 0.019 | 0.5686 | No | ||
| 6 | ZP2 | 1580408 | 6979 | 0.015 | 0.5632 | No | ||
| 7 | CNTN4 | 1780300 5570577 6370019 | 7352 | 0.009 | 0.5459 | No | ||
| 8 | CRTAM | 4480110 | 7989 | -0.002 | 0.5122 | No | ||
| 9 | HNT | 6450731 | 8213 | -0.005 | 0.5018 | No | ||
| 10 | SLIT2 | 1940037 | 8318 | -0.007 | 0.4982 | No | ||
| 11 | CLEC7A | 1990121 3450736 3800064 4610035 | 9045 | -0.019 | 0.4650 | No | ||
| 12 | PCDH12 | 5340044 | 9703 | -0.030 | 0.4388 | No | ||
| 13 | VCAN | 3290017 5910053 6940014 | 11000 | -0.059 | 0.3870 | No | ||
| 14 | COLEC12 | 2690717 4590086 | 11527 | -0.074 | 0.3811 | No |