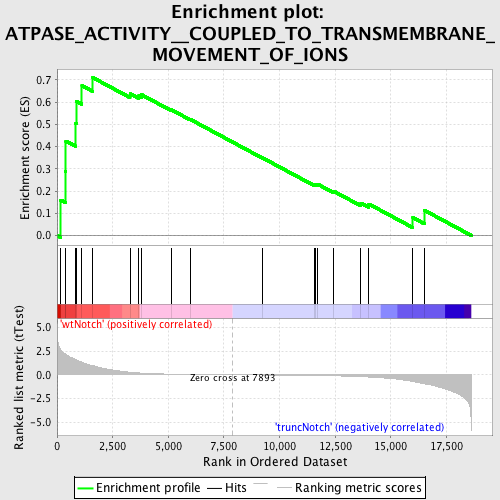
Profile of the Running ES Score & Positions of GeneSet Members on the Rank Ordered List
| Dataset | Set_03_truncNotch_versus_wtNotch.phenotype_truncNotch_versus_wtNotch.cls #wtNotch_versus_truncNotch.phenotype_truncNotch_versus_wtNotch.cls #wtNotch_versus_truncNotch_repos |
| Phenotype | phenotype_truncNotch_versus_wtNotch.cls#wtNotch_versus_truncNotch_repos |
| Upregulated in class | wtNotch |
| GeneSet | ATPASE_ACTIVITY__COUPLED_TO_TRANSMEMBRANE_MOVEMENT_OF_IONS |
| Enrichment Score (ES) | 0.7103374 |
| Normalized Enrichment Score (NES) | 1.5949488 |
| Nominal p-value | 0.023640662 |
| FDR q-value | 0.32636684 |
| FWER p-Value | 0.982 |

| PROBE | DESCRIPTION (from dataset) | GENE SYMBOL | GENE_TITLE | RANK IN GENE LIST | RANK METRIC SCORE | RUNNING ES | CORE ENRICHMENT | |
|---|---|---|---|---|---|---|---|---|
| 1 | ATP2A2 | 1090075 3990279 | 164 | 2.633 | 0.1595 | Yes | ||
| 2 | ATP1B3 | 6040128 | 368 | 2.191 | 0.2887 | Yes | ||
| 3 | ATP6V1C1 | 2690324 5220528 | 394 | 2.150 | 0.4248 | Yes | ||
| 4 | ATP1A1 | 5670451 | 839 | 1.613 | 0.5041 | Yes | ||
| 5 | ATP1B1 | 3130594 | 875 | 1.572 | 0.6028 | Yes | ||
| 6 | ATP6V1B2 | 4060528 | 1116 | 1.319 | 0.6742 | Yes | ||
| 7 | ATP2A3 | 130440 2190451 | 1603 | 0.974 | 0.7103 | Yes | ||
| 8 | ATP2C1 | 2630446 6520253 | 3277 | 0.271 | 0.6377 | No | ||
| 9 | ATP1B2 | 4480603 | 3677 | 0.193 | 0.6286 | No | ||
| 10 | ATP4A | 6220154 | 3799 | 0.174 | 0.6332 | No | ||
| 11 | ATP7A | 6550168 | 5140 | 0.067 | 0.5654 | No | ||
| 12 | ATP7B | 2060711 2470039 3140301 6650735 | 5979 | 0.037 | 0.5227 | No | ||
| 13 | ATP2B3 | 2260022 3780059 | 9241 | -0.022 | 0.3488 | No | ||
| 14 | ATP6V0C | 1780609 | 11554 | -0.075 | 0.2292 | No | ||
| 15 | ABCB11 | 7040170 | 11623 | -0.076 | 0.2304 | No | ||
| 16 | ATP1A2 | 110278 | 11696 | -0.079 | 0.2316 | No | ||
| 17 | ATP4B | 1740156 | 12417 | -0.109 | 0.1999 | No | ||
| 18 | FXYD2 | 1400280 2350719 3520184 7040377 | 13654 | -0.195 | 0.1459 | No | ||
| 19 | ATP1A3 | 5690674 | 14011 | -0.233 | 0.1416 | No | ||
| 20 | ATP6V0E1 | 6760053 | 15990 | -0.707 | 0.0805 | No | ||
| 21 | ATP2A1 | 110309 | 16523 | -0.949 | 0.1126 | No |

