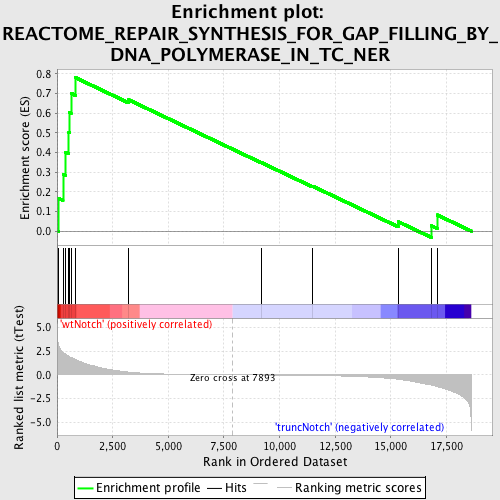
Profile of the Running ES Score & Positions of GeneSet Members on the Rank Ordered List
| Dataset | Set_03_truncNotch_versus_wtNotch.phenotype_truncNotch_versus_wtNotch.cls #wtNotch_versus_truncNotch.phenotype_truncNotch_versus_wtNotch.cls #wtNotch_versus_truncNotch_repos |
| Phenotype | phenotype_truncNotch_versus_wtNotch.cls#wtNotch_versus_truncNotch_repos |
| Upregulated in class | wtNotch |
| GeneSet | REACTOME_REPAIR_SYNTHESIS_FOR_GAP_FILLING_BY_DNA_POLYMERASE_IN_TC_NER |
| Enrichment Score (ES) | 0.78090847 |
| Normalized Enrichment Score (NES) | 1.5705818 |
| Nominal p-value | 0.023640662 |
| FDR q-value | 0.290383 |
| FWER p-Value | 0.986 |
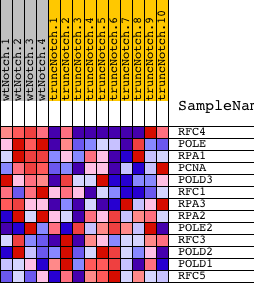
| PROBE | DESCRIPTION (from dataset) | GENE SYMBOL | GENE_TITLE | RANK IN GENE LIST | RANK METRIC SCORE | RUNNING ES | CORE ENRICHMENT | |
|---|---|---|---|---|---|---|---|---|
| 1 | RFC4 | 3800082 6840142 | 64 | 3.081 | 0.1667 | Yes | ||
| 2 | POLE | 6020538 | 265 | 2.398 | 0.2883 | Yes | ||
| 3 | RPA1 | 360452 | 385 | 2.159 | 0.4011 | Yes | ||
| 4 | PCNA | 940754 | 526 | 1.941 | 0.5008 | Yes | ||
| 5 | POLD3 | 6400278 | 553 | 1.899 | 0.6042 | Yes | ||
| 6 | RFC1 | 1190673 | 630 | 1.828 | 0.7010 | Yes | ||
| 7 | RPA3 | 5700136 | 821 | 1.631 | 0.7809 | Yes | ||
| 8 | RPA2 | 2760301 5420195 | 3221 | 0.283 | 0.6676 | No | ||
| 9 | POLE2 | 6110041 | 9182 | -0.021 | 0.3484 | No | ||
| 10 | RFC3 | 1980600 | 11471 | -0.072 | 0.2294 | No | ||
| 11 | POLD2 | 6400148 | 15333 | -0.469 | 0.0477 | No | ||
| 12 | POLD1 | 4830026 | 16821 | -1.079 | 0.0274 | No | ||
| 13 | RFC5 | 3800452 6020091 | 17085 | -1.251 | 0.0823 | No |