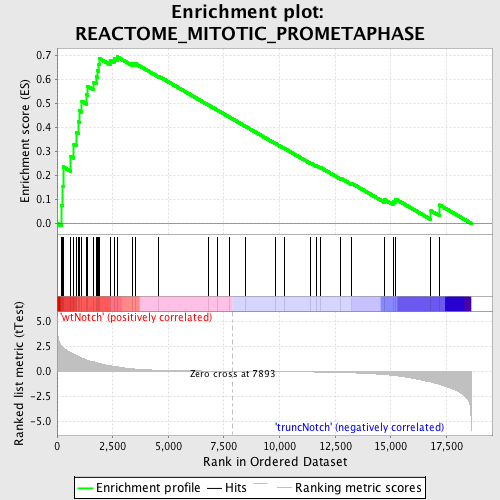
Profile of the Running ES Score & Positions of GeneSet Members on the Rank Ordered List
| Dataset | Set_03_truncNotch_versus_wtNotch.phenotype_truncNotch_versus_wtNotch.cls #wtNotch_versus_truncNotch.phenotype_truncNotch_versus_wtNotch.cls #wtNotch_versus_truncNotch_repos |
| Phenotype | phenotype_truncNotch_versus_wtNotch.cls#wtNotch_versus_truncNotch_repos |
| Upregulated in class | wtNotch |
| GeneSet | REACTOME_MITOTIC_PROMETAPHASE |
| Enrichment Score (ES) | 0.69246066 |
| Normalized Enrichment Score (NES) | 1.755009 |
| Nominal p-value | 0.0 |
| FDR q-value | 0.1343474 |
| FWER p-Value | 0.25 |
| PROBE | DESCRIPTION (from dataset) | GENE SYMBOL | GENE_TITLE | RANK IN GENE LIST | RANK METRIC SCORE | RUNNING ES | CORE ENRICHMENT | |
|---|---|---|---|---|---|---|---|---|
| 1 | NUP107 | 6380021 | 196 | 2.542 | 0.0760 | Yes | ||
| 2 | BUB1B | 1450288 | 261 | 2.413 | 0.1546 | Yes | ||
| 3 | MAD2L1 | 4480725 | 273 | 2.379 | 0.2350 | Yes | ||
| 4 | MAPRE1 | 3290037 | 620 | 1.839 | 0.2789 | Yes | ||
| 5 | SGOL2 | 2030338 | 755 | 1.693 | 0.3294 | Yes | ||
| 6 | NDC80 | 4120465 | 867 | 1.583 | 0.3772 | Yes | ||
| 7 | ZWINT | 6940670 | 954 | 1.481 | 0.4230 | Yes | ||
| 8 | NUP160 | 1990551 | 1008 | 1.419 | 0.4685 | Yes | ||
| 9 | CDCA8 | 2340286 6980019 | 1114 | 1.320 | 0.5077 | Yes | ||
| 10 | SMC1A | 3060600 5700148 5890113 6370154 | 1333 | 1.130 | 0.5344 | Yes | ||
| 11 | ZW10 | 2900735 3520687 | 1362 | 1.103 | 0.5705 | Yes | ||
| 12 | KNTC1 | 430079 | 1652 | 0.940 | 0.5869 | Yes | ||
| 13 | RAD21 | 1990278 | 1781 | 0.856 | 0.6092 | Yes | ||
| 14 | NUP43 | 3360482 | 1810 | 0.839 | 0.6362 | Yes | ||
| 15 | CENPA | 5080154 | 1872 | 0.803 | 0.6602 | Yes | ||
| 16 | BIRC5 | 110408 580014 1770632 | 1894 | 0.790 | 0.6860 | Yes | ||
| 17 | SEC13 | 380577 | 2387 | 0.549 | 0.6782 | Yes | ||
| 18 | STAG2 | 4540132 | 2560 | 0.485 | 0.6854 | Yes | ||
| 19 | RANBP2 | 4280338 | 2707 | 0.437 | 0.6925 | Yes | ||
| 20 | PPP1CC | 6380300 2510647 | 3376 | 0.251 | 0.6650 | No | ||
| 21 | CLASP1 | 6860279 | 3529 | 0.218 | 0.6643 | No | ||
| 22 | MLF1IP | 3610367 | 4570 | 0.098 | 0.6116 | No | ||
| 23 | CENPC1 | 610273 | 6826 | 0.018 | 0.4908 | No | ||
| 24 | CLASP2 | 2510139 | 7204 | 0.011 | 0.4709 | No | ||
| 25 | XPO1 | 540707 | 7753 | 0.002 | 0.4415 | No | ||
| 26 | BUB1 | 5390270 | 8457 | -0.009 | 0.4040 | No | ||
| 27 | KIF2A | 3990286 6130575 | 9800 | -0.032 | 0.3328 | No | ||
| 28 | SGOL1 | 1980075 5220092 6020711 | 10214 | -0.040 | 0.3120 | No | ||
| 29 | PAFAH1B1 | 4230333 6420121 6450066 | 11397 | -0.070 | 0.2507 | No | ||
| 30 | NUP37 | 2370097 6370435 6380008 | 11643 | -0.077 | 0.2402 | No | ||
| 31 | CLIP1 | 2850162 6770397 | 11827 | -0.084 | 0.2332 | No | ||
| 32 | CENPE | 2850022 | 12747 | -0.126 | 0.1880 | No | ||
| 33 | PLK1 | 1780369 2640121 | 13227 | -0.159 | 0.1676 | No | ||
| 34 | KIF2B | 5700066 | 14730 | -0.341 | 0.0984 | No | ||
| 35 | CDC20 | 3440017 3440044 6220088 | 15103 | -0.413 | 0.0924 | No | ||
| 36 | BUB3 | 3170546 | 15220 | -0.440 | 0.1011 | No | ||
| 37 | RANGAP1 | 2320593 6650601 | 16802 | -1.071 | 0.0525 | No | ||
| 38 | PMF1 | 5130273 | 17191 | -1.325 | 0.0767 | No |

