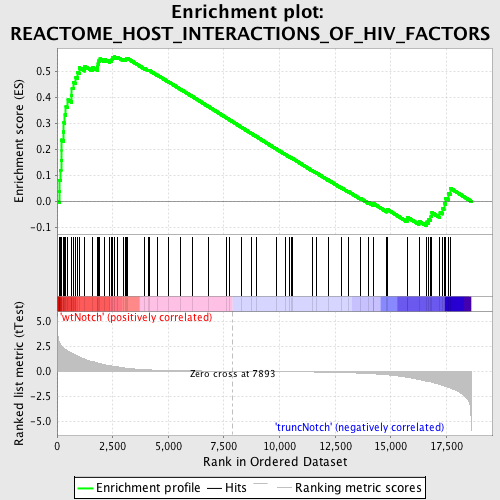
Profile of the Running ES Score & Positions of GeneSet Members on the Rank Ordered List
| Dataset | Set_03_truncNotch_versus_wtNotch.phenotype_truncNotch_versus_wtNotch.cls #wtNotch_versus_truncNotch.phenotype_truncNotch_versus_wtNotch.cls #wtNotch_versus_truncNotch_repos |
| Phenotype | phenotype_truncNotch_versus_wtNotch.cls#wtNotch_versus_truncNotch_repos |
| Upregulated in class | wtNotch |
| GeneSet | REACTOME_HOST_INTERACTIONS_OF_HIV_FACTORS |
| Enrichment Score (ES) | 0.55507815 |
| Normalized Enrichment Score (NES) | 1.5802685 |
| Nominal p-value | 0.0028169013 |
| FDR q-value | 0.28752205 |
| FWER p-Value | 0.974 |
| PROBE | DESCRIPTION (from dataset) | GENE SYMBOL | GENE_TITLE | RANK IN GENE LIST | RANK METRIC SCORE | RUNNING ES | CORE ENRICHMENT | |
|---|---|---|---|---|---|---|---|---|
| 1 | KPNB1 | 1690138 | 110 | 2.828 | 0.0375 | Yes | ||
| 2 | PSMD14 | 5690593 | 119 | 2.806 | 0.0802 | Yes | ||
| 3 | CD4 | 1090010 | 147 | 2.701 | 0.1203 | Yes | ||
| 4 | TCEB1 | 1170619 | 176 | 2.605 | 0.1588 | Yes | ||
| 5 | NUP107 | 6380021 | 196 | 2.542 | 0.1969 | Yes | ||
| 6 | PSMA4 | 4560427 | 198 | 2.539 | 0.2359 | Yes | ||
| 7 | PSMD7 | 2030619 6220594 | 293 | 2.337 | 0.2667 | Yes | ||
| 8 | KPNA1 | 5270324 | 304 | 2.308 | 0.3016 | Yes | ||
| 9 | PSMA2 | 6510093 | 353 | 2.215 | 0.3331 | Yes | ||
| 10 | NUP93 | 2190273 | 397 | 2.143 | 0.3637 | Yes | ||
| 11 | PSMD12 | 730044 | 488 | 2.007 | 0.3897 | Yes | ||
| 12 | AP1G1 | 2360671 | 653 | 1.793 | 0.4084 | Yes | ||
| 13 | PAK2 | 360438 7050068 | 668 | 1.783 | 0.4350 | Yes | ||
| 14 | ARF1 | 3840291 | 724 | 1.718 | 0.4585 | Yes | ||
| 15 | PSMD10 | 520494 1170576 3830050 | 842 | 1.611 | 0.4769 | Yes | ||
| 16 | NUP155 | 5720576 6220114 | 928 | 1.497 | 0.4954 | Yes | ||
| 17 | NUP160 | 1990551 | 1008 | 1.419 | 0.5129 | Yes | ||
| 18 | PSMD4 | 430068 | 1236 | 1.214 | 0.5193 | Yes | ||
| 19 | CD28 | 1400739 4210093 | 1578 | 0.983 | 0.5161 | Yes | ||
| 20 | NUP43 | 3360482 | 1810 | 0.839 | 0.5165 | Yes | ||
| 21 | PSME1 | 450193 4480035 | 1836 | 0.823 | 0.5278 | Yes | ||
| 22 | PSMD3 | 1400647 | 1854 | 0.811 | 0.5393 | Yes | ||
| 23 | NUPL2 | 6550537 | 1926 | 0.772 | 0.5474 | Yes | ||
| 24 | PSMC5 | 2760315 6550021 | 2143 | 0.650 | 0.5457 | Yes | ||
| 25 | PSMC6 | 2810021 | 2356 | 0.560 | 0.5429 | Yes | ||
| 26 | PSMC4 | 580050 1580025 | 2463 | 0.518 | 0.5451 | Yes | ||
| 27 | PSME3 | 2810537 | 2475 | 0.515 | 0.5524 | Yes | ||
| 28 | NUP54 | 940546 2360156 4060278 | 2565 | 0.483 | 0.5551 | Yes | ||
| 29 | RANBP2 | 4280338 | 2707 | 0.437 | 0.5542 | No | ||
| 30 | RANBP1 | 430215 1090180 | 2977 | 0.349 | 0.5450 | No | ||
| 31 | PSMB1 | 2940402 | 3086 | 0.317 | 0.5441 | No | ||
| 32 | PSMB2 | 940035 4210324 | 3097 | 0.313 | 0.5484 | No | ||
| 33 | CDK9 | 630707 | 3180 | 0.290 | 0.5484 | No | ||
| 34 | RAE1 | 7050121 | 3940 | 0.154 | 0.5098 | No | ||
| 35 | PSMC2 | 7040010 | 4109 | 0.135 | 0.5029 | No | ||
| 36 | RBX1 | 2120010 2340047 | 4144 | 0.132 | 0.5031 | No | ||
| 37 | TCEB2 | 840204 1340400 1450082 | 4500 | 0.102 | 0.4855 | No | ||
| 38 | PSMD11 | 2340538 6510053 | 5028 | 0.072 | 0.4582 | No | ||
| 39 | PSMB5 | 6290242 | 5566 | 0.050 | 0.4300 | No | ||
| 40 | NUP153 | 7000452 | 6085 | 0.035 | 0.4026 | No | ||
| 41 | RAN | 2260446 4590647 | 6789 | 0.019 | 0.3649 | No | ||
| 42 | PSMD8 | 630142 | 7603 | 0.005 | 0.3212 | No | ||
| 43 | XPO1 | 540707 | 7753 | 0.002 | 0.3132 | No | ||
| 44 | PSMA6 | 50609 | 8309 | -0.006 | 0.2833 | No | ||
| 45 | AP2B1 | 1450184 2370148 3520139 4850593 | 8752 | -0.014 | 0.2597 | No | ||
| 46 | NUP35 | 5340408 | 8956 | -0.018 | 0.2490 | No | ||
| 47 | PSMD5 | 3940139 4570041 | 9847 | -0.033 | 0.2015 | No | ||
| 48 | PSMC3 | 2480184 | 10249 | -0.041 | 0.1805 | No | ||
| 49 | PSMA3 | 5900047 7040161 | 10440 | -0.045 | 0.1710 | No | ||
| 50 | TPR | 1990066 6550390 | 10526 | -0.047 | 0.1671 | No | ||
| 51 | B2M | 5080332 5130059 | 10559 | -0.048 | 0.1661 | No | ||
| 52 | PSMB9 | 6980471 | 11460 | -0.072 | 0.1187 | No | ||
| 53 | NUP37 | 2370097 6370435 6380008 | 11643 | -0.077 | 0.1101 | No | ||
| 54 | HCK | 4230592 | 12176 | -0.098 | 0.0829 | No | ||
| 55 | PSMB4 | 520402 | 12769 | -0.127 | 0.0529 | No | ||
| 56 | CCNT1 | 2450563 5390184 | 13093 | -0.149 | 0.0378 | No | ||
| 57 | NUP188 | 1190470 | 13655 | -0.195 | 0.0105 | No | ||
| 58 | PPIA | 2900368 4850162 | 13982 | -0.230 | -0.0035 | No | ||
| 59 | PSMA5 | 5390537 | 14212 | -0.258 | -0.0119 | No | ||
| 60 | FYN | 2100468 4760520 4850687 | 14227 | -0.260 | -0.0087 | No | ||
| 61 | AP1B1 | 4290373 | 14825 | -0.354 | -0.0354 | No | ||
| 62 | PSMB3 | 4280594 | 14852 | -0.359 | -0.0313 | No | ||
| 63 | PSMB10 | 630504 6510039 | 15732 | -0.604 | -0.0694 | No | ||
| 64 | PSMB6 | 2690711 | 15755 | -0.612 | -0.0612 | No | ||
| 65 | BANF1 | 460164 2850170 6110139 | 16267 | -0.831 | -0.0760 | No | ||
| 66 | PSMA7 | 2230131 | 16610 | -0.993 | -0.0792 | No | ||
| 67 | PACS1 | 4810372 | 16699 | -1.021 | -0.0682 | No | ||
| 68 | RANGAP1 | 2320593 6650601 | 16802 | -1.071 | -0.0573 | No | ||
| 69 | LCK | 3360142 | 16840 | -1.087 | -0.0426 | No | ||
| 70 | PSMD9 | 50020 5890368 | 17209 | -1.336 | -0.0419 | No | ||
| 71 | PSMC1 | 6350538 | 17333 | -1.414 | -0.0268 | No | ||
| 72 | AP2A2 | 130082 | 17393 | -1.459 | -0.0075 | No | ||
| 73 | PSMA1 | 380059 2760195 | 17467 | -1.500 | 0.0116 | No | ||
| 74 | NUP62 | 1240128 | 17585 | -1.591 | 0.0297 | No | ||
| 75 | PSMD2 | 4670706 5050364 | 17675 | -1.679 | 0.0507 | No |

