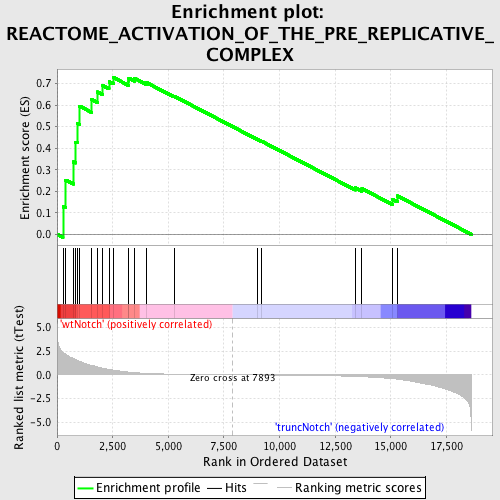
Profile of the Running ES Score & Positions of GeneSet Members on the Rank Ordered List
| Dataset | Set_03_truncNotch_versus_wtNotch.phenotype_truncNotch_versus_wtNotch.cls #wtNotch_versus_truncNotch.phenotype_truncNotch_versus_wtNotch.cls #wtNotch_versus_truncNotch_repos |
| Phenotype | phenotype_truncNotch_versus_wtNotch.cls#wtNotch_versus_truncNotch_repos |
| Upregulated in class | wtNotch |
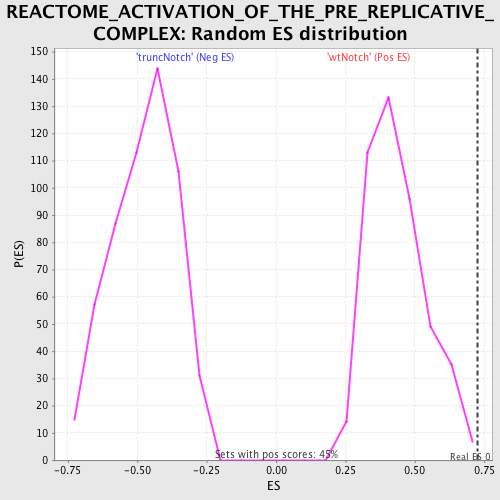
| GeneSet | REACTOME_ACTIVATION_OF_THE_PRE_REPLICATIVE_COMPLEX |
| Enrichment Score (ES) | 0.7276403 |
| Normalized Enrichment Score (NES) | 1.6686261 |
| Nominal p-value | 0.004474273 |
| FDR q-value | 0.15526244 |
| FWER p-Value | 0.709 |
| PROBE | DESCRIPTION (from dataset) | GENE SYMBOL | GENE_TITLE | RANK IN GENE LIST | RANK METRIC SCORE | RUNNING ES | CORE ENRICHMENT | |
|---|---|---|---|---|---|---|---|---|
| 1 | POLE | 6020538 | 265 | 2.398 | 0.1291 | Yes | ||
| 2 | RPA1 | 360452 | 385 | 2.159 | 0.2518 | Yes | ||
| 3 | CDC7 | 4060546 4850041 | 725 | 1.718 | 0.3363 | Yes | ||
| 4 | RPA3 | 5700136 | 821 | 1.631 | 0.4287 | Yes | ||
| 5 | MCM4 | 2760673 5420711 | 904 | 1.538 | 0.5163 | Yes | ||
| 6 | ORC5L | 1940133 1940711 | 1013 | 1.414 | 0.5950 | Yes | ||
| 7 | PRIM1 | 6420746 | 1539 | 0.999 | 0.6265 | Yes | ||
| 8 | MCM6 | 60092 540181 6510110 | 1822 | 0.831 | 0.6610 | Yes | ||
| 9 | CDC45L | 70537 3130114 | 2050 | 0.690 | 0.6900 | Yes | ||
| 10 | MCM7 | 3290292 5220056 | 2334 | 0.569 | 0.7088 | Yes | ||
| 11 | ORC4L | 4230538 5550288 | 2535 | 0.494 | 0.7276 | Yes | ||
| 12 | CDK2 | 130484 2260301 4010088 5050110 | 3216 | 0.284 | 0.7080 | No | ||
| 13 | RPA2 | 2760301 5420195 | 3221 | 0.283 | 0.7248 | No | ||
| 14 | ORC1L | 2370328 6110390 | 3473 | 0.230 | 0.7250 | No | ||
| 15 | ORC2L | 1990470 6510019 | 4029 | 0.144 | 0.7038 | No | ||
| 16 | MCM10 | 4920632 | 5254 | 0.062 | 0.6416 | No | ||
| 17 | POLA1 | 4760541 | 9007 | -0.018 | 0.4410 | No | ||
| 18 | POLE2 | 6110041 | 9182 | -0.021 | 0.4329 | No | ||
| 19 | MCM3 | 5570068 | 13403 | -0.172 | 0.2162 | No | ||
| 20 | POLA2 | 940519 | 13700 | -0.200 | 0.2123 | No | ||
| 21 | MCM5 | 2680647 | 15085 | -0.411 | 0.1624 | No | ||
| 22 | MCM2 | 5050139 | 15297 | -0.459 | 0.1785 | No |