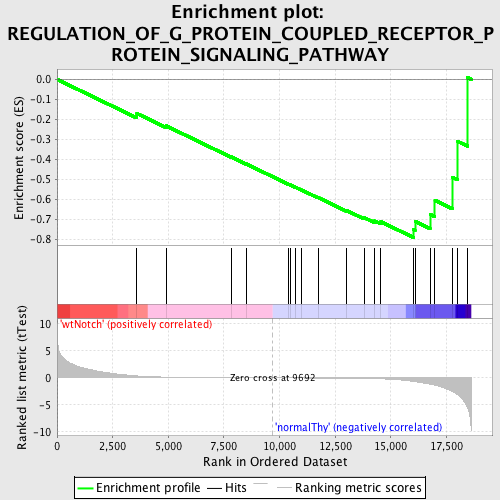
Profile of the Running ES Score & Positions of GeneSet Members on the Rank Ordered List
| Dataset | Set_03_wtNotch_versus_normalThy.phenotype_wtNotch_versus_normalThy.cls #wtNotch_versus_normalThy.phenotype_wtNotch_versus_normalThy.cls #wtNotch_versus_normalThy_repos |
| Phenotype | phenotype_wtNotch_versus_normalThy.cls#wtNotch_versus_normalThy_repos |
| Upregulated in class | normalThy |
| GeneSet | REGULATION_OF_G_PROTEIN_COUPLED_RECEPTOR_PROTEIN_SIGNALING_PATHWAY |
| Enrichment Score (ES) | -0.790131 |
| Normalized Enrichment Score (NES) | -1.5731196 |
| Nominal p-value | 0.013182675 |
| FDR q-value | 0.24401702 |
| FWER p-Value | 0.956 |
| PROBE | DESCRIPTION (from dataset) | GENE SYMBOL | GENE_TITLE | RANK IN GENE LIST | RANK METRIC SCORE | RUNNING ES | CORE ENRICHMENT | |
|---|---|---|---|---|---|---|---|---|
| 1 | GNG7 | 1940019 | 3584 | 0.364 | -0.1702 | No | ||
| 2 | GRK5 | 1940348 4670053 | 4902 | 0.140 | -0.2323 | No | ||
| 3 | GNG4 | 2630600 | 7820 | 0.031 | -0.3873 | No | ||
| 4 | RGS20 | 4540541 4730086 | 8495 | 0.019 | -0.4224 | No | ||
| 5 | GRK4 | 3840347 5340113 | 10392 | -0.010 | -0.5237 | No | ||
| 6 | RGS2 | 1090736 | 10477 | -0.011 | -0.5275 | No | ||
| 7 | ADRB3 | 6900072 | 10718 | -0.015 | -0.5395 | No | ||
| 8 | GRK1 | 1410112 | 10998 | -0.020 | -0.5532 | No | ||
| 9 | RGS11 | 2360041 | 11734 | -0.033 | -0.5907 | No | ||
| 10 | RGS4 | 2970711 | 13010 | -0.067 | -0.6552 | No | ||
| 11 | RGS9 | 1050273 | 13796 | -0.106 | -0.6908 | No | ||
| 12 | PLCE1 | 4780685 | 14279 | -0.147 | -0.7077 | No | ||
| 13 | RGS3 | 60670 540736 1340180 1500369 3390735 4010131 4610402 6380114 | 14553 | -0.173 | -0.7116 | No | ||
| 14 | GRK6 | 1500053 | 16014 | -0.659 | -0.7493 | Yes | ||
| 15 | RGS12 | 1190082 5390369 | 16091 | -0.707 | -0.7097 | Yes | ||
| 16 | GIT2 | 6040039 6770181 | 16766 | -1.141 | -0.6753 | Yes | ||
| 17 | RGS16 | 780091 | 16984 | -1.327 | -0.6049 | Yes | ||
| 18 | RAMP1 | 2320168 | 17760 | -2.546 | -0.4889 | Yes | ||
| 19 | ADRB2 | 3290373 | 18009 | -3.105 | -0.3101 | Yes | ||
| 20 | RGS14 | 380086 | 18446 | -5.536 | 0.0091 | Yes |

