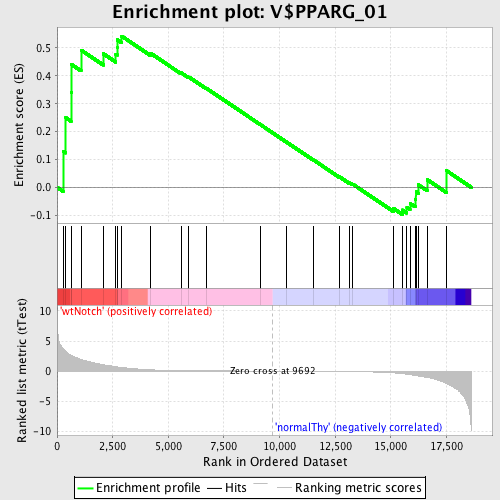
Profile of the Running ES Score & Positions of GeneSet Members on the Rank Ordered List
| Dataset | Set_03_wtNotch_versus_normalThy.phenotype_wtNotch_versus_normalThy.cls #wtNotch_versus_normalThy.phenotype_wtNotch_versus_normalThy.cls #wtNotch_versus_normalThy_repos |
| Phenotype | phenotype_wtNotch_versus_normalThy.cls#wtNotch_versus_normalThy_repos |
| Upregulated in class | wtNotch |
| GeneSet | V$PPARG_01 |
| Enrichment Score (ES) | 0.5425061 |
| Normalized Enrichment Score (NES) | 1.1686347 |
| Nominal p-value | 0.240991 |
| FDR q-value | 1.0 |
| FWER p-Value | 1.0 |
| PROBE | DESCRIPTION (from dataset) | GENE SYMBOL | GENE_TITLE | RANK IN GENE LIST | RANK METRIC SCORE | RUNNING ES | CORE ENRICHMENT | |
|---|---|---|---|---|---|---|---|---|
| 1 | MRPS28 | 2230373 | 271 | 3.722 | 0.1296 | Yes | ||
| 2 | SFRS6 | 60224 | 391 | 3.264 | 0.2496 | Yes | ||
| 3 | SMYD5 | 6220025 | 629 | 2.654 | 0.3396 | Yes | ||
| 4 | SNRPF | 3170280 | 640 | 2.631 | 0.4409 | Yes | ||
| 5 | EEF1B2 | 4850400 6130161 | 1078 | 1.937 | 0.4924 | Yes | ||
| 6 | NR2F6 | 1340239 5670239 60338 4280088 | 2079 | 1.048 | 0.4792 | Yes | ||
| 7 | PAK4 | 1690152 | 2639 | 0.739 | 0.4778 | Yes | ||
| 8 | NR2C1 | 2570605 | 2699 | 0.711 | 0.5021 | Yes | ||
| 9 | RQCD1 | 1850139 | 2706 | 0.708 | 0.5292 | Yes | ||
| 10 | AGPS | 6980184 | 2903 | 0.615 | 0.5425 | Yes | ||
| 11 | GRPEL1 | 3180240 | 4211 | 0.217 | 0.4806 | No | ||
| 12 | SYT6 | 2510280 3850128 4540064 | 5583 | 0.098 | 0.4106 | No | ||
| 13 | PPARGC1A | 4670040 | 5917 | 0.082 | 0.3959 | No | ||
| 14 | PAX7 | 6860593 | 6704 | 0.055 | 0.3557 | No | ||
| 15 | GOLGA4 | 460300 | 9139 | 0.008 | 0.2251 | No | ||
| 16 | GPR124 | 510292 6290047 | 10322 | -0.009 | 0.1618 | No | ||
| 17 | PRRX2 | 4260603 | 11532 | -0.029 | 0.0979 | No | ||
| 18 | NDUFS1 | 2650253 | 12678 | -0.055 | 0.0385 | No | ||
| 19 | CNTFR | 4480092 6200064 | 13147 | -0.072 | 0.0161 | No | ||
| 20 | RPL27 | 1940088 | 13280 | -0.078 | 0.0120 | No | ||
| 21 | USP37 | 2470433 | 15129 | -0.285 | -0.0764 | No | ||
| 22 | APOM | 2340010 | 15518 | -0.418 | -0.0811 | No | ||
| 23 | ZIC4 | 1500082 | 15724 | -0.510 | -0.0724 | No | ||
| 24 | HSD17B8 | 1940647 | 15865 | -0.578 | -0.0576 | No | ||
| 25 | MAGMAS | 580064 4920452 | 16096 | -0.708 | -0.0425 | No | ||
| 26 | AP1B1 | 4290373 | 16131 | -0.730 | -0.0161 | No | ||
| 27 | DNAJA2 | 2630253 6860358 | 16235 | -0.794 | 0.0091 | No | ||
| 28 | ESRRA | 6550242 | 16633 | -1.031 | 0.0277 | No | ||
| 29 | ZSWIM3 | 1230563 | 17506 | -2.039 | 0.0597 | No |

