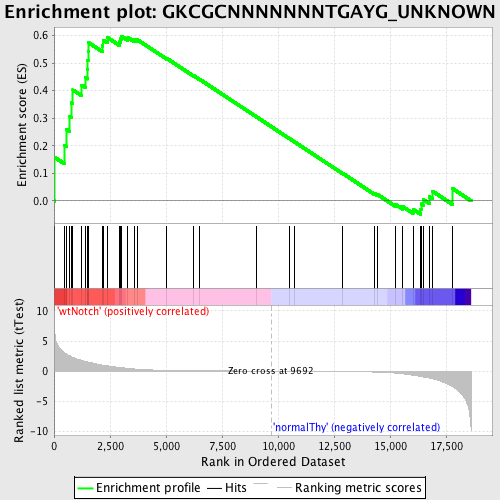
Profile of the Running ES Score & Positions of GeneSet Members on the Rank Ordered List
| Dataset | Set_03_wtNotch_versus_normalThy.phenotype_wtNotch_versus_normalThy.cls #wtNotch_versus_normalThy.phenotype_wtNotch_versus_normalThy.cls #wtNotch_versus_normalThy_repos |
| Phenotype | phenotype_wtNotch_versus_normalThy.cls#wtNotch_versus_normalThy_repos |
| Upregulated in class | wtNotch |
| GeneSet | GKCGCNNNNNNNTGAYG_UNKNOWN |
| Enrichment Score (ES) | 0.5980317 |
| Normalized Enrichment Score (NES) | 1.3414893 |
| Nominal p-value | 0.07356322 |
| FDR q-value | 0.7674698 |
| FWER p-Value | 1.0 |
| PROBE | DESCRIPTION (from dataset) | GENE SYMBOL | GENE_TITLE | RANK IN GENE LIST | RANK METRIC SCORE | RUNNING ES | CORE ENRICHMENT | |
|---|---|---|---|---|---|---|---|---|
| 1 | MRPL49 | 460541 610162 5340156 | 22 | 7.249 | 0.1584 | Yes | ||
| 2 | PHF5A | 2690519 | 451 | 3.056 | 0.2027 | Yes | ||
| 3 | COQ7 | 3190632 | 545 | 2.823 | 0.2598 | Yes | ||
| 4 | PSME3 | 2810537 | 703 | 2.529 | 0.3071 | Yes | ||
| 5 | PHF7 | 1510519 | 777 | 2.389 | 0.3557 | Yes | ||
| 6 | RFC1 | 1190673 | 840 | 2.283 | 0.4026 | Yes | ||
| 7 | PINX1 | 3360154 | 1239 | 1.777 | 0.4203 | Yes | ||
| 8 | NUP155 | 5720576 6220114 | 1409 | 1.617 | 0.4468 | Yes | ||
| 9 | NEK1 | 4570059 | 1493 | 1.538 | 0.4762 | Yes | ||
| 10 | NUPL2 | 6550537 | 1502 | 1.530 | 0.5095 | Yes | ||
| 11 | BAP1 | 3830131 | 1519 | 1.514 | 0.5420 | Yes | ||
| 12 | ACO2 | 4230600 | 1526 | 1.509 | 0.5749 | Yes | ||
| 13 | NUP133 | 2360168 4760017 | 2155 | 1.003 | 0.5631 | Yes | ||
| 14 | CNOT7 | 2450338 5720397 | 2182 | 0.999 | 0.5837 | Yes | ||
| 15 | BRMS1 | 6860280 | 2378 | 0.896 | 0.5930 | Yes | ||
| 16 | RNF7 | 2030242 | 2925 | 0.605 | 0.5769 | Yes | ||
| 17 | GPAM | 1740180 | 2964 | 0.589 | 0.5878 | Yes | ||
| 18 | RCE1 | 1980372 | 3008 | 0.569 | 0.5980 | Yes | ||
| 19 | RNF141 | 130463 6840041 | 3296 | 0.460 | 0.5927 | No | ||
| 20 | QTRTD1 | 7000053 | 3594 | 0.359 | 0.5846 | No | ||
| 21 | RANBP2 | 4280338 | 3721 | 0.318 | 0.5848 | No | ||
| 22 | UBE4A | 6100520 | 5025 | 0.130 | 0.5176 | No | ||
| 23 | ANAPC10 | 870086 1170037 2260129 | 6235 | 0.070 | 0.4540 | No | ||
| 24 | MFN2 | 2260195 6100164 | 6480 | 0.061 | 0.4422 | No | ||
| 25 | NUP153 | 7000452 | 9033 | 0.010 | 0.3051 | No | ||
| 26 | NFX1 | 450504 | 10522 | -0.012 | 0.2253 | No | ||
| 27 | RNPS1 | 610736 1090021 | 10733 | -0.015 | 0.2143 | No | ||
| 28 | ABCE1 | 4280050 | 12861 | -0.061 | 0.1012 | No | ||
| 29 | UXT | 110019 5080066 | 14307 | -0.149 | 0.0267 | No | ||
| 30 | LCMT1 | 2230551 3830497 | 14438 | -0.163 | 0.0233 | No | ||
| 31 | BCL2L2 | 2760692 6770739 | 15246 | -0.324 | -0.0131 | No | ||
| 32 | DHRS1 | 5220673 | 15556 | -0.434 | -0.0201 | No | ||
| 33 | FAU | 7100465 | 16024 | -0.664 | -0.0307 | No | ||
| 34 | ORMDL3 | 1340711 | 16371 | -0.883 | -0.0298 | No | ||
| 35 | SENP2 | 4540452 | 16384 | -0.889 | -0.0109 | No | ||
| 36 | GTF3C2 | 670494 | 16475 | -0.948 | 0.0051 | No | ||
| 37 | DNAJB11 | 4150168 | 16758 | -1.133 | 0.0149 | No | ||
| 38 | PSMB2 | 940035 4210324 | 16898 | -1.247 | 0.0349 | No | ||
| 39 | ALS2CR2 | 6450128 7100092 | 17791 | -2.614 | 0.0444 | No |

