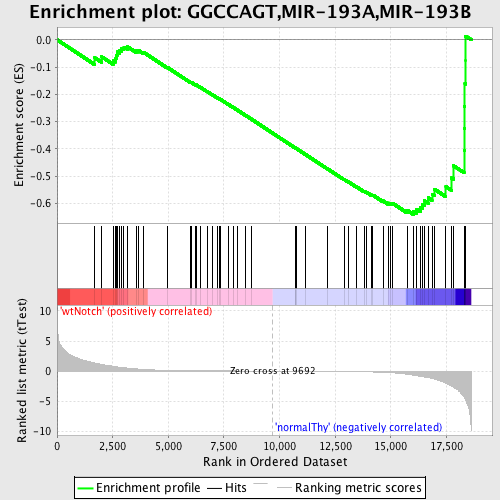
Profile of the Running ES Score & Positions of GeneSet Members on the Rank Ordered List
| Dataset | Set_03_wtNotch_versus_normalThy.phenotype_wtNotch_versus_normalThy.cls #wtNotch_versus_normalThy.phenotype_wtNotch_versus_normalThy.cls #wtNotch_versus_normalThy_repos |
| Phenotype | phenotype_wtNotch_versus_normalThy.cls#wtNotch_versus_normalThy_repos |
| Upregulated in class | normalThy |
| GeneSet | GGCCAGT,MIR-193A,MIR-193B |
| Enrichment Score (ES) | -0.64043677 |
| Normalized Enrichment Score (NES) | -1.5264436 |
| Nominal p-value | 0.0033557047 |
| FDR q-value | 0.123008095 |
| FWER p-Value | 0.727 |
| PROBE | DESCRIPTION (from dataset) | GENE SYMBOL | GENE_TITLE | RANK IN GENE LIST | RANK METRIC SCORE | RUNNING ES | CORE ENRICHMENT | |
|---|---|---|---|---|---|---|---|---|
| 1 | SFRS2 | 50707 380593 | 1695 | 1.356 | -0.0663 | No | ||
| 2 | UBAP2 | 460398 | 2000 | 1.104 | -0.0622 | No | ||
| 3 | CELSR2 | 2320148 6220152 | 2520 | 0.808 | -0.0752 | No | ||
| 4 | PAK4 | 1690152 | 2639 | 0.739 | -0.0679 | No | ||
| 5 | YWHAZ | 1230717 | 2671 | 0.728 | -0.0561 | No | ||
| 6 | STMN1 | 1990717 | 2698 | 0.711 | -0.0444 | No | ||
| 7 | PHF15 | 6550066 6860673 | 2816 | 0.652 | -0.0386 | No | ||
| 8 | CRSP2 | 1940059 | 2885 | 0.625 | -0.0307 | No | ||
| 9 | ANKFY1 | 360309 5390021 | 3004 | 0.572 | -0.0265 | No | ||
| 10 | AP2M1 | 2570338 | 3153 | 0.517 | -0.0249 | No | ||
| 11 | MMP19 | 5080377 | 3552 | 0.375 | -0.0394 | No | ||
| 12 | LRRC8A | 2510193 | 3654 | 0.335 | -0.0386 | No | ||
| 13 | PPP2R5C | 3310121 6650672 | 3893 | 0.277 | -0.0463 | No | ||
| 14 | SON | 3120148 5860239 7040403 | 4954 | 0.136 | -0.1010 | No | ||
| 15 | LAMC2 | 450692 2680041 4200059 4670148 | 5991 | 0.079 | -0.1553 | No | ||
| 16 | KCNJ2 | 630019 | 6025 | 0.078 | -0.1557 | No | ||
| 17 | HSPA14 | 4610487 | 6214 | 0.070 | -0.1645 | No | ||
| 18 | MKLN1 | 70504 1850129 | 6242 | 0.069 | -0.1647 | No | ||
| 19 | CALB1 | 460070 | 6444 | 0.062 | -0.1744 | No | ||
| 20 | KCNH8 | 3940129 | 6758 | 0.053 | -0.1903 | No | ||
| 21 | EN2 | 7000368 | 6967 | 0.048 | -0.2006 | No | ||
| 22 | ACACA | 2490612 2680369 | 7206 | 0.043 | -0.2126 | No | ||
| 23 | SIX4 | 6760022 | 7278 | 0.041 | -0.2157 | No | ||
| 24 | ETV1 | 70735 2940603 5080463 | 7339 | 0.040 | -0.2182 | No | ||
| 25 | NPAS4 | 2320204 4150154 | 7717 | 0.033 | -0.2379 | No | ||
| 26 | ARHGEF12 | 3990195 | 7937 | 0.029 | -0.2492 | No | ||
| 27 | DIO2 | 380504 540403 | 8109 | 0.025 | -0.2579 | No | ||
| 28 | HOXD13 | 2260603 | 8475 | 0.019 | -0.2772 | No | ||
| 29 | MMP16 | 2680139 | 8729 | 0.015 | -0.2906 | No | ||
| 30 | CAPN3 | 1980451 6940047 | 10699 | -0.015 | -0.3964 | No | ||
| 31 | TAOK2 | 110575 6380692 | 10719 | -0.015 | -0.3972 | No | ||
| 32 | ZIC3 | 380020 | 10743 | -0.016 | -0.3981 | No | ||
| 33 | MAX | 5220021 | 11147 | -0.022 | -0.4194 | No | ||
| 34 | FLRT3 | 70685 2760497 6040519 | 12148 | -0.042 | -0.4726 | No | ||
| 35 | ARPC5 | 1740411 3450300 | 12908 | -0.063 | -0.5123 | No | ||
| 36 | IGFBP5 | 2360592 | 13091 | -0.069 | -0.5208 | No | ||
| 37 | ERBB4 | 4610400 4810017 | 13448 | -0.085 | -0.5384 | No | ||
| 38 | NRIP1 | 3190039 | 13797 | -0.106 | -0.5552 | No | ||
| 39 | PLAU | 6510047 | 13903 | -0.113 | -0.5588 | No | ||
| 40 | STX16 | 70315 | 14134 | -0.132 | -0.5687 | No | ||
| 41 | RAB6B | 5860121 | 14194 | -0.138 | -0.5694 | No | ||
| 42 | LUZP1 | 940075 4280458 6180070 | 14655 | -0.188 | -0.5907 | No | ||
| 43 | LAMP2 | 1230402 1980373 | 14876 | -0.229 | -0.5983 | No | ||
| 44 | SLC39A5 | 2900100 4610440 | 14973 | -0.253 | -0.5988 | No | ||
| 45 | E2F6 | 3120133 3850332 4070324 | 15091 | -0.278 | -0.6000 | No | ||
| 46 | ING5 | 3830440 5910239 6200471 6650576 | 15736 | -0.516 | -0.6251 | No | ||
| 47 | DNAJC13 | 4730091 | 16021 | -0.662 | -0.6282 | Yes | ||
| 48 | GRB7 | 2100471 | 16160 | -0.742 | -0.6219 | Yes | ||
| 49 | KIT | 7040095 | 16331 | -0.857 | -0.6152 | Yes | ||
| 50 | PTPRF | 1770528 3190044 | 16425 | -0.912 | -0.6033 | Yes | ||
| 51 | ZHX3 | 460615 | 16514 | -0.974 | -0.5900 | Yes | ||
| 52 | CDK10 | 60164 1190717 3130128 3990044 | 16682 | -1.068 | -0.5793 | Yes | ||
| 53 | PTEN | 3390064 | 16854 | -1.207 | -0.5661 | Yes | ||
| 54 | ETV6 | 610524 | 16961 | -1.305 | -0.5477 | Yes | ||
| 55 | BAZ2A | 730184 | 17477 | -1.996 | -0.5385 | Yes | ||
| 56 | CD47 | 1850603 | 17731 | -2.476 | -0.5063 | Yes | ||
| 57 | BRPF1 | 3170139 | 17816 | -2.661 | -0.4616 | Yes | ||
| 58 | DYRK1A | 3190181 | 18295 | -4.333 | -0.4072 | Yes | ||
| 59 | ZBTB5 | 770279 | 18304 | -4.388 | -0.3264 | Yes | ||
| 60 | ZNRF1 | 70592 | 18315 | -4.452 | -0.2446 | Yes | ||
| 61 | MCL1 | 1660672 | 18331 | -4.573 | -0.1607 | Yes | ||
| 62 | CBX7 | 3940035 | 18363 | -4.752 | -0.0745 | Yes | ||
| 63 | MAP3K3 | 610685 | 18366 | -4.757 | 0.0135 | Yes |

