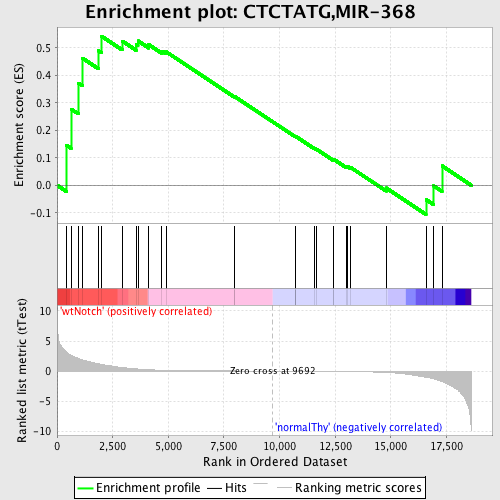
Profile of the Running ES Score & Positions of GeneSet Members on the Rank Ordered List
| Dataset | Set_03_wtNotch_versus_normalThy.phenotype_wtNotch_versus_normalThy.cls #wtNotch_versus_normalThy.phenotype_wtNotch_versus_normalThy.cls #wtNotch_versus_normalThy_repos |
| Phenotype | phenotype_wtNotch_versus_normalThy.cls#wtNotch_versus_normalThy_repos |
| Upregulated in class | wtNotch |
| GeneSet | CTCTATG,MIR-368 |
| Enrichment Score (ES) | 0.5421813 |
| Normalized Enrichment Score (NES) | 1.1730642 |
| Nominal p-value | 0.21551724 |
| FDR q-value | 1.0 |
| FWER p-Value | 1.0 |
| PROBE | DESCRIPTION (from dataset) | GENE SYMBOL | GENE_TITLE | RANK IN GENE LIST | RANK METRIC SCORE | RUNNING ES | CORE ENRICHMENT | |
|---|---|---|---|---|---|---|---|---|
| 1 | CSTF3 | 3850156 5570458 | 427 | 3.129 | 0.1452 | Yes | ||
| 2 | PTGES2 | 4210097 | 630 | 2.650 | 0.2769 | Yes | ||
| 3 | GRB2 | 6650398 | 957 | 2.091 | 0.3717 | Yes | ||
| 4 | DLX1 | 360168 | 1144 | 1.861 | 0.4618 | Yes | ||
| 5 | SFRS3 | 770315 4230593 | 1862 | 1.224 | 0.4890 | Yes | ||
| 6 | VPS54 | 1660168 | 1988 | 1.115 | 0.5422 | Yes | ||
| 7 | FBXL3 | 5910142 | 2926 | 0.604 | 0.5243 | No | ||
| 8 | MMP19 | 5080377 | 3552 | 0.375 | 0.5108 | No | ||
| 9 | RNF11 | 3990068 5080458 | 3636 | 0.342 | 0.5247 | No | ||
| 10 | PAX2 | 6040270 7000133 | 4120 | 0.232 | 0.5112 | No | ||
| 11 | NFIB | 460450 | 4710 | 0.157 | 0.4880 | No | ||
| 12 | SEPT7 | 2760685 | 4906 | 0.140 | 0.4850 | No | ||
| 13 | SATB2 | 2470181 | 7951 | 0.028 | 0.3227 | No | ||
| 14 | BDNF | 2940128 3520368 | 7993 | 0.028 | 0.3220 | No | ||
| 15 | CAPN3 | 1980451 6940047 | 10699 | -0.015 | 0.1773 | No | ||
| 16 | CACNA1G | 3060161 4810706 5550722 | 10723 | -0.015 | 0.1769 | No | ||
| 17 | EYA4 | 5360286 | 10726 | -0.015 | 0.1776 | No | ||
| 18 | DACH1 | 2450593 5700592 | 11576 | -0.030 | 0.1336 | No | ||
| 19 | TM2D1 | 1230129 | 11660 | -0.031 | 0.1308 | No | ||
| 20 | MEF2C | 670025 780338 | 12428 | -0.048 | 0.0921 | No | ||
| 21 | SET | 6650286 | 12430 | -0.048 | 0.0946 | No | ||
| 22 | RGS4 | 2970711 | 13010 | -0.067 | 0.0671 | No | ||
| 23 | UTS2 | 50239 6020132 | 13030 | -0.067 | 0.0696 | No | ||
| 24 | ZDHHC1 | 3870035 | 13180 | -0.073 | 0.0656 | No | ||
| 25 | MYLK | 4010600 7000364 | 14789 | -0.211 | -0.0096 | No | ||
| 26 | CABLES1 | 610253 2190504 | 16584 | -1.006 | -0.0520 | No | ||
| 27 | FEM1C | 60300 6130717 6980164 | 16931 | -1.273 | -0.0022 | No | ||
| 28 | CNIH | 2190484 5080609 | 17304 | -1.726 | 0.0706 | No |

