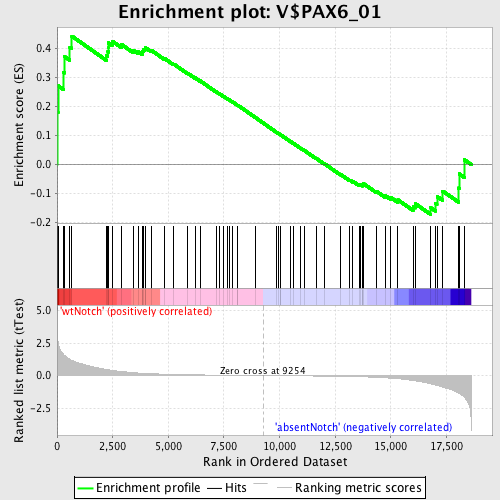
Profile of the Running ES Score & Positions of GeneSet Members on the Rank Ordered List
| Dataset | Set_03_absentNotch_versus_wtNotch.phenotype_absentNotch_versus_wtNotch.cls #wtNotch_versus_absentNotch |
| Phenotype | phenotype_absentNotch_versus_wtNotch.cls#wtNotch_versus_absentNotch |
| Upregulated in class | wtNotch |
| GeneSet | V$PAX6_01 |
| Enrichment Score (ES) | 0.44260725 |
| Normalized Enrichment Score (NES) | 1.1920326 |
| Nominal p-value | 0.16222222 |
| FDR q-value | 1.0 |
| FWER p-Value | 1.0 |
| PROBE | DESCRIPTION (from dataset) | GENE SYMBOL | GENE_TITLE | RANK IN GENE LIST | RANK METRIC SCORE | RUNNING ES | CORE ENRICHMENT | |
|---|---|---|---|---|---|---|---|---|
| 1 | POU2AF1 | 5690242 | 1 | 4.937 | 0.1807 | Yes | ||
| 2 | RTN4RL1 | 2630368 | 44 | 2.549 | 0.2718 | Yes | ||
| 3 | HMGA1 | 6580408 | 293 | 1.609 | 0.3174 | Yes | ||
| 4 | PDCD10 | 4760500 | 330 | 1.549 | 0.3722 | Yes | ||
| 5 | SLC26A6 | 4810575 | 573 | 1.242 | 0.4046 | Yes | ||
| 6 | TAX1BP3 | 940706 6100687 6220176 | 662 | 1.168 | 0.4426 | Yes | ||
| 7 | TRERF1 | 6370017 6940138 | 2232 | 0.462 | 0.3749 | No | ||
| 8 | MAP2K5 | 2030440 | 2282 | 0.448 | 0.3887 | No | ||
| 9 | YARS | 70739 | 2304 | 0.441 | 0.4037 | No | ||
| 10 | STOML2 | 1940487 | 2311 | 0.439 | 0.4195 | No | ||
| 11 | SUMO1 | 1990364 2760338 6380195 | 2474 | 0.393 | 0.4252 | No | ||
| 12 | UBE2N | 520369 2900047 | 2888 | 0.307 | 0.4142 | No | ||
| 13 | SNX26 | 6660215 | 3422 | 0.222 | 0.3935 | No | ||
| 14 | TAF5 | 3450288 5890193 6860435 | 3640 | 0.195 | 0.3890 | No | ||
| 15 | JARID2 | 6290538 | 3835 | 0.177 | 0.3850 | No | ||
| 16 | SOSTDC1 | 6760017 | 3840 | 0.176 | 0.3912 | No | ||
| 17 | XKRX | 3800192 | 3875 | 0.172 | 0.3957 | No | ||
| 18 | ERG | 50154 1770739 | 3951 | 0.166 | 0.3977 | No | ||
| 19 | JMJD1C | 940575 2120025 | 3954 | 0.165 | 0.4037 | No | ||
| 20 | GLRA1 | 610575 | 4241 | 0.140 | 0.3934 | No | ||
| 21 | CHRDL1 | 1580037 6380204 | 4833 | 0.104 | 0.3653 | No | ||
| 22 | CNTFR | 4480092 6200064 | 5242 | 0.085 | 0.3464 | No | ||
| 23 | TITF1 | 3390554 4540292 | 5862 | 0.062 | 0.3153 | No | ||
| 24 | FIP1L1 | 4590538 6510333 | 6198 | 0.053 | 0.2992 | No | ||
| 25 | OTP | 2630070 | 6425 | 0.047 | 0.2887 | No | ||
| 26 | FLI1 | 3990142 | 7143 | 0.032 | 0.2513 | No | ||
| 27 | FSTL5 | 770280 | 7280 | 0.030 | 0.2450 | No | ||
| 28 | DKK2 | 3610433 | 7498 | 0.026 | 0.2343 | No | ||
| 29 | TCF4 | 520021 | 7669 | 0.023 | 0.2260 | No | ||
| 30 | SLC5A3 | 4280167 | 7733 | 0.022 | 0.2234 | No | ||
| 31 | GPM6A | 1660044 2750152 | 7864 | 0.020 | 0.2171 | No | ||
| 32 | SP7 | 1050315 | 8101 | 0.017 | 0.2050 | No | ||
| 33 | PHOX2B | 5270075 | 8109 | 0.016 | 0.2052 | No | ||
| 34 | SERPINI1 | 2940468 | 8919 | 0.004 | 0.1618 | No | ||
| 35 | SDPR | 3360292 | 9867 | -0.008 | 0.1111 | No | ||
| 36 | SLC6A5 | 870121 | 9930 | -0.009 | 0.1081 | No | ||
| 37 | TWIST1 | 5130619 | 10033 | -0.011 | 0.1030 | No | ||
| 38 | USP9X | 130435 2370735 3120338 | 10040 | -0.011 | 0.1030 | No | ||
| 39 | RHOBTB3 | 4010687 | 10508 | -0.018 | 0.0785 | No | ||
| 40 | BHLHB5 | 6510520 | 10616 | -0.020 | 0.0735 | No | ||
| 41 | NOX4 | 6040136 | 10946 | -0.025 | 0.0566 | No | ||
| 42 | TEAD1 | 2470551 | 11124 | -0.027 | 0.0481 | No | ||
| 43 | PTPN4 | 1410047 | 11637 | -0.037 | 0.0218 | No | ||
| 44 | CPA4 | 3610100 | 12000 | -0.044 | 0.0039 | No | ||
| 45 | DMD | 1740041 3990332 | 12741 | -0.062 | -0.0337 | No | ||
| 46 | MBNL1 | 2640762 7100048 | 13161 | -0.075 | -0.0535 | No | ||
| 47 | KIF12 | 4590014 | 13298 | -0.080 | -0.0579 | No | ||
| 48 | GNAZ | 6130296 | 13586 | -0.092 | -0.0700 | No | ||
| 49 | ETV1 | 70735 2940603 5080463 | 13625 | -0.094 | -0.0686 | No | ||
| 50 | DSCAM | 1780050 2450731 2810438 | 13725 | -0.098 | -0.0704 | No | ||
| 51 | SRPK2 | 6380341 | 13729 | -0.098 | -0.0669 | No | ||
| 52 | RORB | 6400035 | 13753 | -0.099 | -0.0645 | No | ||
| 53 | RRAGA | 6400603 | 14371 | -0.138 | -0.0928 | No | ||
| 54 | SOX4 | 2260091 | 14749 | -0.169 | -0.1069 | No | ||
| 55 | PDGFRA | 2940332 | 14994 | -0.197 | -0.1128 | No | ||
| 56 | JPH1 | 610739 | 15320 | -0.240 | -0.1216 | No | ||
| 57 | RRM1 | 4150433 | 16003 | -0.383 | -0.1443 | No | ||
| 58 | OVOL1 | 1690131 | 16101 | -0.406 | -0.1346 | No | ||
| 59 | KCNN3 | 6520600 6420138 | 16792 | -0.634 | -0.1486 | No | ||
| 60 | LMNA | 520471 1500075 3190167 4210020 | 17007 | -0.724 | -0.1336 | No | ||
| 61 | HNRPA0 | 2680048 | 17077 | -0.758 | -0.1096 | No | ||
| 62 | H2AFZ | 1470168 | 17329 | -0.879 | -0.0909 | No | ||
| 63 | SH2D1A | 4760025 | 18046 | -1.338 | -0.0805 | No | ||
| 64 | SERTAD4 | 130593 | 18075 | -1.373 | -0.0318 | No | ||
| 65 | NFYB | 1850053 | 18303 | -1.663 | 0.0169 | No |

