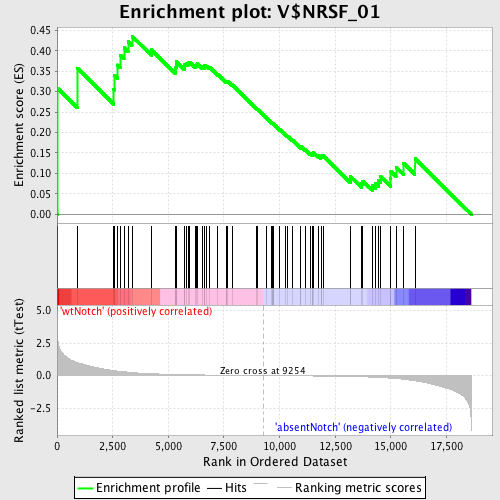
Profile of the Running ES Score & Positions of GeneSet Members on the Rank Ordered List
| Dataset | Set_03_absentNotch_versus_wtNotch.phenotype_absentNotch_versus_wtNotch.cls #wtNotch_versus_absentNotch |
| Phenotype | phenotype_absentNotch_versus_wtNotch.cls#wtNotch_versus_absentNotch |
| Upregulated in class | wtNotch |
| GeneSet | V$NRSF_01 |
| Enrichment Score (ES) | 0.43606052 |
| Normalized Enrichment Score (NES) | 1.2023695 |
| Nominal p-value | 0.1388889 |
| FDR q-value | 1.0 |
| FWER p-Value | 1.0 |
| PROBE | DESCRIPTION (from dataset) | GENE SYMBOL | GENE_TITLE | RANK IN GENE LIST | RANK METRIC SCORE | RUNNING ES | CORE ENRICHMENT | |
|---|---|---|---|---|---|---|---|---|
| 1 | HES1 | 4810280 | 10 | 3.181 | 0.3085 | Yes | ||
| 2 | DDX25 | 5910121 | 899 | 1.001 | 0.3578 | Yes | ||
| 3 | HCN3 | 3940438 6840750 | 2541 | 0.377 | 0.3060 | Yes | ||
| 4 | CHRNB2 | 580204 3120739 | 2578 | 0.369 | 0.3399 | Yes | ||
| 5 | CHKA | 510324 | 2718 | 0.340 | 0.3654 | Yes | ||
| 6 | CDK5R1 | 3870161 | 2846 | 0.314 | 0.3891 | Yes | ||
| 7 | DNER | 3610170 | 3008 | 0.287 | 0.4083 | Yes | ||
| 8 | SCAMP5 | 5550368 6290021 | 3190 | 0.255 | 0.4233 | Yes | ||
| 9 | LHX3 | 670164 1770280 | 3367 | 0.229 | 0.4361 | Yes | ||
| 10 | GLRA1 | 610575 | 4241 | 0.140 | 0.4026 | No | ||
| 11 | HTR5A | 1940253 | 5304 | 0.082 | 0.3533 | No | ||
| 12 | MAPK11 | 130452 3120440 3610465 | 5335 | 0.081 | 0.3596 | No | ||
| 13 | POU4F2 | 2120195 2570022 | 5358 | 0.080 | 0.3662 | No | ||
| 14 | PHYHIPL | 2360706 3840692 | 5373 | 0.079 | 0.3731 | No | ||
| 15 | FGF12 | 1740446 2360037 | 5736 | 0.066 | 0.3600 | No | ||
| 16 | KCNH8 | 3940129 | 5742 | 0.066 | 0.3661 | No | ||
| 17 | BDNF | 2940128 3520368 | 5794 | 0.064 | 0.3695 | No | ||
| 18 | ATP2B2 | 3780397 | 5885 | 0.061 | 0.3706 | No | ||
| 19 | SYT6 | 2510280 3850128 4540064 | 5957 | 0.059 | 0.3725 | No | ||
| 20 | MGAT5B | 380131 2570364 | 6216 | 0.052 | 0.3637 | No | ||
| 21 | NPPB | 4150722 | 6275 | 0.051 | 0.3655 | No | ||
| 22 | L1CAM | 4850021 | 6302 | 0.050 | 0.3690 | No | ||
| 23 | ATP6V0A1 | 1570082 3870441 4230044 | 6534 | 0.045 | 0.3608 | No | ||
| 24 | OMG | 6760066 | 6609 | 0.043 | 0.3610 | No | ||
| 25 | SST | 6590142 | 6615 | 0.043 | 0.3649 | No | ||
| 26 | HCN1 | 5130458 | 6733 | 0.040 | 0.3625 | No | ||
| 27 | ELAVL3 | 2850014 | 6851 | 0.038 | 0.3599 | No | ||
| 28 | RPH3A | 2190156 | 7229 | 0.031 | 0.3426 | No | ||
| 29 | SCN3B | 840112 1780152 5910685 6100131 | 7610 | 0.024 | 0.3244 | No | ||
| 30 | SLC17A6 | 4210576 | 7632 | 0.024 | 0.3256 | No | ||
| 31 | CHAT | 6840603 | 7667 | 0.023 | 0.3261 | No | ||
| 32 | COL5A3 | 1940471 | 7879 | 0.020 | 0.3166 | No | ||
| 33 | VIP | 2850647 | 8950 | 0.004 | 0.2593 | No | ||
| 34 | APBB1 | 2690338 | 9011 | 0.003 | 0.2564 | No | ||
| 35 | STMN2 | 6220181 | 9432 | -0.002 | 0.2340 | No | ||
| 36 | SEZ6 | 3450722 | 9614 | -0.005 | 0.2247 | No | ||
| 37 | POU4F3 | 2690035 | 9660 | -0.005 | 0.2228 | No | ||
| 38 | GDAP1L1 | 1660066 | 9688 | -0.006 | 0.2219 | No | ||
| 39 | TNRC4 | 4050156 | 9710 | -0.006 | 0.2214 | No | ||
| 40 | CALB1 | 460070 | 9736 | -0.007 | 0.2206 | No | ||
| 41 | HTR1A | 6980441 | 10012 | -0.011 | 0.2068 | No | ||
| 42 | SLC12A5 | 1980692 | 10281 | -0.015 | 0.1938 | No | ||
| 43 | KCNIP2 | 60088 1780324 | 10359 | -0.015 | 0.1912 | No | ||
| 44 | GABRB3 | 4150164 | 10569 | -0.019 | 0.1817 | No | ||
| 45 | CRYBA2 | 5900138 | 10937 | -0.025 | 0.1643 | No | ||
| 46 | PRG3 | 6220020 | 10957 | -0.025 | 0.1657 | No | ||
| 47 | PCSK2 | 360017 430528 5900619 | 11158 | -0.028 | 0.1576 | No | ||
| 48 | PTPRN | 5900577 | 11371 | -0.031 | 0.1493 | No | ||
| 49 | CHGA | 1990056 6550463 | 11471 | -0.033 | 0.1472 | No | ||
| 50 | GLRA3 | 2570500 | 11491 | -0.034 | 0.1494 | No | ||
| 51 | RNF13 | 2370021 | 11506 | -0.034 | 0.1520 | No | ||
| 52 | GRM1 | 5890324 | 11733 | -0.038 | 0.1435 | No | ||
| 53 | GABRG2 | 2350402 4210204 6130279 6550037 | 11861 | -0.041 | 0.1406 | No | ||
| 54 | DRD3 | 4780402 | 11897 | -0.041 | 0.1428 | No | ||
| 55 | GHSR | 1980465 7050521 | 11959 | -0.043 | 0.1436 | No | ||
| 56 | TRIM9 | 1230672 2120162 6450100 6450687 | 13183 | -0.076 | 0.0851 | No | ||
| 57 | PAQR4 | 730736 | 13188 | -0.076 | 0.0923 | No | ||
| 58 | FGD2 | 5340195 | 13676 | -0.096 | 0.0754 | No | ||
| 59 | TCF1 | 5390022 | 13745 | -0.099 | 0.0813 | No | ||
| 60 | SYT4 | 5080193 | 14171 | -0.124 | 0.0705 | No | ||
| 61 | DRD2 | 5890369 | 14302 | -0.133 | 0.0764 | No | ||
| 62 | RASGRF1 | 730068 6940402 | 14453 | -0.144 | 0.0823 | No | ||
| 63 | GRIN1 | 3800014 7000609 | 14533 | -0.151 | 0.0926 | No | ||
| 64 | DBC1 | 4610156 | 14983 | -0.196 | 0.0874 | No | ||
| 65 | BARHL1 | 4210113 | 15005 | -0.198 | 0.1055 | No | ||
| 66 | SNAP25 | 360520 | 15235 | -0.228 | 0.1154 | No | ||
| 67 | CDKN2B | 6020040 | 15576 | -0.285 | 0.1247 | No | ||
| 68 | NEFH | 630239 | 16086 | -0.403 | 0.1364 | No |

