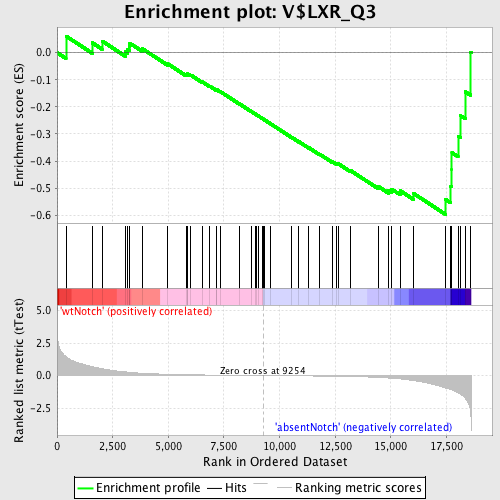
Profile of the Running ES Score & Positions of GeneSet Members on the Rank Ordered List
| Dataset | Set_03_absentNotch_versus_wtNotch.phenotype_absentNotch_versus_wtNotch.cls #wtNotch_versus_absentNotch |
| Phenotype | phenotype_absentNotch_versus_wtNotch.cls#wtNotch_versus_absentNotch |
| Upregulated in class | absentNotch |
| GeneSet | V$LXR_Q3 |
| Enrichment Score (ES) | -0.5975087 |
| Normalized Enrichment Score (NES) | -1.5229013 |
| Nominal p-value | 0.011235955 |
| FDR q-value | 0.18480733 |
| FWER p-Value | 0.814 |
| PROBE | DESCRIPTION (from dataset) | GENE SYMBOL | GENE_TITLE | RANK IN GENE LIST | RANK METRIC SCORE | RUNNING ES | CORE ENRICHMENT | |
|---|---|---|---|---|---|---|---|---|
| 1 | FKBP2 | 2320025 | 401 | 1.442 | 0.0612 | No | ||
| 2 | CIC | 6370161 | 1585 | 0.677 | 0.0364 | No | ||
| 3 | BLVRB | 7040707 | 2024 | 0.524 | 0.0429 | No | ||
| 4 | NR5A1 | 70707 | 3063 | 0.278 | 0.0030 | No | ||
| 5 | NR2E1 | 4730288 | 3175 | 0.257 | 0.0118 | No | ||
| 6 | STAG2 | 4540132 | 3252 | 0.245 | 0.0218 | No | ||
| 7 | MAPKAPK3 | 630520 | 3267 | 0.243 | 0.0350 | No | ||
| 8 | JARID2 | 6290538 | 3835 | 0.177 | 0.0146 | No | ||
| 9 | CCNI | 1340020 | 4965 | 0.097 | -0.0406 | No | ||
| 10 | RARG | 6760136 | 5805 | 0.064 | -0.0822 | No | ||
| 11 | TITF1 | 3390554 4540292 | 5862 | 0.062 | -0.0816 | No | ||
| 12 | PHF15 | 6550066 6860673 | 5863 | 0.062 | -0.0781 | No | ||
| 13 | HPCAL4 | 2600484 | 6005 | 0.058 | -0.0824 | No | ||
| 14 | SULF1 | 430575 | 6526 | 0.045 | -0.1078 | No | ||
| 15 | ELAVL3 | 2850014 | 6851 | 0.038 | -0.1231 | No | ||
| 16 | PHOX2A | 6650121 | 7144 | 0.032 | -0.1369 | No | ||
| 17 | AMD1 | 6290128 | 7149 | 0.032 | -0.1353 | No | ||
| 18 | MAFB | 1230471 | 7325 | 0.029 | -0.1431 | No | ||
| 19 | MAP2K7 | 2260086 | 8192 | 0.015 | -0.1888 | No | ||
| 20 | SPRY2 | 5860184 | 8733 | 0.007 | -0.2175 | No | ||
| 21 | GREM1 | 3940180 | 8897 | 0.005 | -0.2260 | No | ||
| 22 | PPARD | 110131 | 8951 | 0.004 | -0.2287 | No | ||
| 23 | ETV4 | 2450605 | 9060 | 0.003 | -0.2343 | No | ||
| 24 | MITF | 380056 | 9222 | 0.000 | -0.2430 | No | ||
| 25 | SDCCAG8 | 1780687 | 9273 | -0.000 | -0.2457 | No | ||
| 26 | RARA | 4050161 | 9330 | -0.001 | -0.2486 | No | ||
| 27 | RB1CC1 | 510494 7100072 | 9593 | -0.005 | -0.2625 | No | ||
| 28 | ABCA1 | 6290156 | 10521 | -0.018 | -0.3114 | No | ||
| 29 | SLC2A4 | 540441 | 10870 | -0.023 | -0.3288 | No | ||
| 30 | ACCN2 | 6450465 | 11315 | -0.031 | -0.3509 | No | ||
| 31 | ACCN1 | 2060139 2190541 | 11793 | -0.040 | -0.3743 | No | ||
| 32 | FOXD3 | 6550156 | 12382 | -0.053 | -0.4030 | No | ||
| 33 | DRD1 | 430025 | 12576 | -0.057 | -0.4101 | No | ||
| 34 | SPTBN4 | 4150279 5270286 | 12645 | -0.059 | -0.4103 | No | ||
| 35 | ACSL3 | 3140195 | 13192 | -0.076 | -0.4353 | No | ||
| 36 | HAS2 | 5360181 | 14439 | -0.142 | -0.4943 | No | ||
| 37 | NRG1 | 1050332 | 14898 | -0.187 | -0.5082 | No | ||
| 38 | PCSK1N | 4010435 | 15041 | -0.203 | -0.5042 | No | ||
| 39 | ADAM17 | 360292 | 15422 | -0.257 | -0.5099 | No | ||
| 40 | ACY1 | 2360279 6550161 | 16028 | -0.389 | -0.5202 | No | ||
| 41 | ACACA | 2490612 2680369 | 17465 | -0.961 | -0.5423 | Yes | ||
| 42 | CTCF | 5340017 | 17696 | -1.070 | -0.4933 | Yes | ||
| 43 | SGK | 1400131 2480056 | 17743 | -1.100 | -0.4326 | Yes | ||
| 44 | SPOP | 450035 | 17747 | -1.104 | -0.3694 | Yes | ||
| 45 | NFKBIA | 1570152 | 18024 | -1.317 | -0.3086 | Yes | ||
| 46 | ABCG1 | 60692 | 18129 | -1.423 | -0.2325 | Yes | ||
| 47 | APOC1 | 5900066 6220408 | 18345 | -1.736 | -0.1444 | Yes | ||
| 48 | TMPO | 4050494 | 18577 | -2.767 | 0.0021 | Yes |

