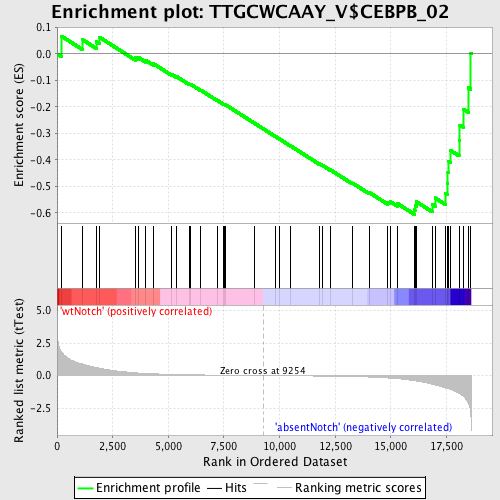
Profile of the Running ES Score & Positions of GeneSet Members on the Rank Ordered List
| Dataset | Set_03_absentNotch_versus_wtNotch.phenotype_absentNotch_versus_wtNotch.cls #wtNotch_versus_absentNotch |
| Phenotype | phenotype_absentNotch_versus_wtNotch.cls#wtNotch_versus_absentNotch |
| Upregulated in class | absentNotch |
| GeneSet | TTGCWCAAY_V$CEBPB_02 |
| Enrichment Score (ES) | -0.6065999 |
| Normalized Enrichment Score (NES) | -1.5072111 |
| Nominal p-value | 0.0073664826 |
| FDR q-value | 0.1600766 |
| FWER p-Value | 0.875 |
| PROBE | DESCRIPTION (from dataset) | GENE SYMBOL | GENE_TITLE | RANK IN GENE LIST | RANK METRIC SCORE | RUNNING ES | CORE ENRICHMENT | |
|---|---|---|---|---|---|---|---|---|
| 1 | MSH5 | 1340019 4730333 | 193 | 1.810 | 0.0675 | No | ||
| 2 | ITPR3 | 4010632 | 1153 | 0.873 | 0.0534 | No | ||
| 3 | B4GALT1 | 6980167 | 1776 | 0.604 | 0.0459 | No | ||
| 4 | CUEDC1 | 1660463 | 1893 | 0.566 | 0.0640 | No | ||
| 5 | WNT5A | 840685 3120152 | 3512 | 0.211 | -0.0140 | No | ||
| 6 | BMF | 610102 | 3658 | 0.193 | -0.0135 | No | ||
| 7 | GSR | 3520079 | 3976 | 0.164 | -0.0235 | No | ||
| 8 | SOX10 | 6200538 | 4333 | 0.134 | -0.0370 | No | ||
| 9 | NRP2 | 4070400 5860041 6650446 | 5139 | 0.089 | -0.0765 | No | ||
| 10 | FGF14 | 2630390 3520075 6770048 | 5366 | 0.079 | -0.0852 | No | ||
| 11 | IL19 | 6040142 | 5944 | 0.059 | -0.1137 | No | ||
| 12 | PITX2 | 870537 2690139 | 6007 | 0.058 | -0.1146 | No | ||
| 13 | DBH | 3610458 | 6448 | 0.047 | -0.1363 | No | ||
| 14 | CLDN10 | 4070364 4590059 4920097 5080687 6620270 | 7192 | 0.031 | -0.1749 | No | ||
| 15 | HOXA5 | 6840026 | 7482 | 0.026 | -0.1894 | No | ||
| 16 | KCNJ2 | 630019 | 7545 | 0.025 | -0.1916 | No | ||
| 17 | SERPINE1 | 4210403 | 7590 | 0.025 | -0.1929 | No | ||
| 18 | ANGPT1 | 3990368 5130288 6770035 | 8885 | 0.005 | -0.2624 | No | ||
| 19 | SAA1 | 5390520 | 9819 | -0.008 | -0.3123 | No | ||
| 20 | PHF16 | 50373 7200161 | 9999 | -0.010 | -0.3215 | No | ||
| 21 | CYP24A1 | 2340338 | 10493 | -0.018 | -0.3473 | No | ||
| 22 | PPL | 2360072 | 11777 | -0.039 | -0.4147 | No | ||
| 23 | CKAP4 | 1050056 | 11914 | -0.042 | -0.4202 | No | ||
| 24 | TRIB1 | 2320435 | 12272 | -0.050 | -0.4373 | No | ||
| 25 | BNC2 | 4810603 | 13271 | -0.079 | -0.4876 | No | ||
| 26 | KLF5 | 3840348 | 14022 | -0.115 | -0.5230 | No | ||
| 27 | SYNCRIP | 1690195 3140113 4670279 | 14861 | -0.182 | -0.5603 | No | ||
| 28 | FGA | 4210056 5220239 | 14963 | -0.193 | -0.5574 | No | ||
| 29 | ZFP36L1 | 2510138 4120048 | 15294 | -0.236 | -0.5650 | No | ||
| 30 | IDH1 | 1990021 | 16067 | -0.399 | -0.5894 | Yes | ||
| 31 | LUZP1 | 940075 4280458 6180070 | 16090 | -0.403 | -0.5733 | Yes | ||
| 32 | MAPK14 | 5290731 | 16148 | -0.418 | -0.5584 | Yes | ||
| 33 | ETV6 | 610524 | 16866 | -0.666 | -0.5683 | Yes | ||
| 34 | PRDX3 | 1690035 | 16991 | -0.717 | -0.5441 | Yes | ||
| 35 | RHOB | 1500309 | 17468 | -0.964 | -0.5283 | Yes | ||
| 36 | EIF4A2 | 1170494 1740711 2850504 | 17540 | -0.997 | -0.4892 | Yes | ||
| 37 | SLC7A11 | 2850138 | 17567 | -1.000 | -0.4476 | Yes | ||
| 38 | SLIT3 | 7100132 | 17604 | -1.015 | -0.4058 | Yes | ||
| 39 | TOB1 | 4150138 | 17679 | -1.057 | -0.3643 | Yes | ||
| 40 | STMN1 | 1990717 | 18068 | -1.364 | -0.3265 | Yes | ||
| 41 | EIF4A1 | 1990341 2810300 | 18104 | -1.391 | -0.2686 | Yes | ||
| 42 | CEBPB | 2970019 | 18268 | -1.593 | -0.2088 | Yes | ||
| 43 | SRPK1 | 450110 | 18484 | -2.155 | -0.1276 | Yes | ||
| 44 | NFKBIE | 580390 2190086 | 18598 | -3.130 | 0.0010 | Yes |

