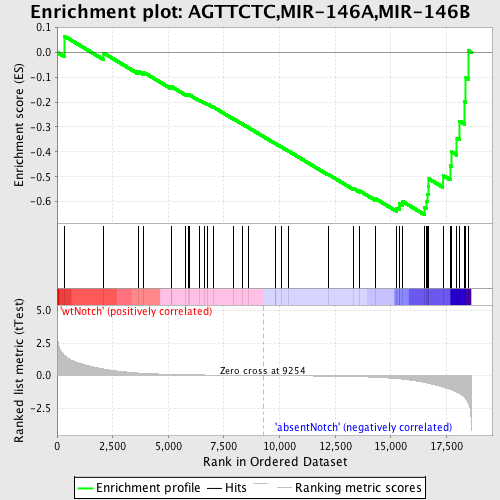
Profile of the Running ES Score & Positions of GeneSet Members on the Rank Ordered List
| Dataset | Set_03_absentNotch_versus_wtNotch.phenotype_absentNotch_versus_wtNotch.cls #wtNotch_versus_absentNotch |
| Phenotype | phenotype_absentNotch_versus_wtNotch.cls#wtNotch_versus_absentNotch |
| Upregulated in class | absentNotch |
| GeneSet | AGTTCTC,MIR-146A,MIR-146B |
| Enrichment Score (ES) | -0.6515272 |
| Normalized Enrichment Score (NES) | -1.6201042 |
| Nominal p-value | 0.0 |
| FDR q-value | 0.1365069 |
| FWER p-Value | 0.347 |
| PROBE | DESCRIPTION (from dataset) | GENE SYMBOL | GENE_TITLE | RANK IN GENE LIST | RANK METRIC SCORE | RUNNING ES | CORE ENRICHMENT | |
|---|---|---|---|---|---|---|---|---|
| 1 | RNF31 | 110035 | 332 | 1.543 | 0.0651 | No | ||
| 2 | ZFX | 5900400 | 2095 | 0.498 | -0.0030 | No | ||
| 3 | BCORL1 | 1660008 | 3646 | 0.194 | -0.0760 | No | ||
| 4 | LRRC15 | 3940609 | 3893 | 0.170 | -0.0801 | No | ||
| 5 | NRP2 | 4070400 5860041 6650446 | 5139 | 0.089 | -0.1424 | No | ||
| 6 | RPS6KB2 | 6220600 | 5152 | 0.088 | -0.1383 | No | ||
| 7 | SEC23IP | 4540484 6200047 | 5779 | 0.064 | -0.1685 | No | ||
| 8 | CASK | 2340215 3290576 6770215 | 5887 | 0.061 | -0.1710 | No | ||
| 9 | DTNA | 1340600 1780731 2340278 2850132 | 5939 | 0.060 | -0.1705 | No | ||
| 10 | RARB | 430139 1410138 | 6383 | 0.048 | -0.1918 | No | ||
| 11 | THRB | 1780673 | 6628 | 0.043 | -0.2027 | No | ||
| 12 | PTGFRN | 4120524 | 6764 | 0.040 | -0.2078 | No | ||
| 13 | SP8 | 4060576 | 7014 | 0.035 | -0.2193 | No | ||
| 14 | HNRPD | 4120021 | 7947 | 0.019 | -0.2685 | No | ||
| 15 | MMP16 | 2680139 | 8311 | 0.013 | -0.2873 | No | ||
| 16 | NPAS4 | 2320204 4150154 | 8617 | 0.009 | -0.3033 | No | ||
| 17 | ARHGAP6 | 2060121 | 9812 | -0.008 | -0.3671 | No | ||
| 18 | STRBP | 4210594 5360239 | 9823 | -0.008 | -0.3673 | No | ||
| 19 | SYT1 | 840364 | 10085 | -0.012 | -0.3807 | No | ||
| 20 | PRX | 2260400 4200347 | 10412 | -0.016 | -0.3974 | No | ||
| 21 | POLR3H | 1980369 6400348 | 12187 | -0.048 | -0.4903 | No | ||
| 22 | NUMB | 2450735 3800253 6350040 | 13320 | -0.081 | -0.5469 | No | ||
| 23 | TM6SF2 | 6770204 | 13595 | -0.092 | -0.5567 | No | ||
| 24 | BIVM | 6040546 | 14323 | -0.134 | -0.5886 | No | ||
| 25 | STC1 | 360161 | 15239 | -0.228 | -0.6256 | Yes | ||
| 26 | PTPRA | 7100110 | 15387 | -0.251 | -0.6200 | Yes | ||
| 27 | IRAK1 | 4120593 | 15392 | -0.251 | -0.6068 | Yes | ||
| 28 | EIF4G2 | 3800575 6860184 | 15535 | -0.278 | -0.5995 | Yes | ||
| 29 | CD79B | 1450066 3390358 | 16503 | -0.528 | -0.6231 | Yes | ||
| 30 | HIPK1 | 110193 | 16620 | -0.569 | -0.5988 | Yes | ||
| 31 | HIC2 | 4010433 | 16648 | -0.577 | -0.5692 | Yes | ||
| 32 | SFRS6 | 60224 | 16682 | -0.590 | -0.5393 | Yes | ||
| 33 | CUGBP2 | 6180121 6840139 | 16713 | -0.606 | -0.5084 | Yes | ||
| 34 | PSMD3 | 1400647 | 17345 | -0.887 | -0.4947 | Yes | ||
| 35 | SMAD4 | 5670519 | 17673 | -1.053 | -0.4557 | Yes | ||
| 36 | TRAF6 | 4810292 6200132 | 17733 | -1.095 | -0.4001 | Yes | ||
| 37 | ELAVL1 | 4730497 | 17973 | -1.270 | -0.3447 | Yes | ||
| 38 | IVNS1ABP | 4760601 6520113 | 18102 | -1.389 | -0.2769 | Yes | ||
| 39 | KCTD15 | 2810735 | 18319 | -1.691 | -0.1977 | Yes | ||
| 40 | KLF7 | 50390 | 18375 | -1.820 | -0.1028 | Yes | ||
| 41 | USP3 | 2060332 | 18483 | -2.154 | 0.0072 | Yes |

