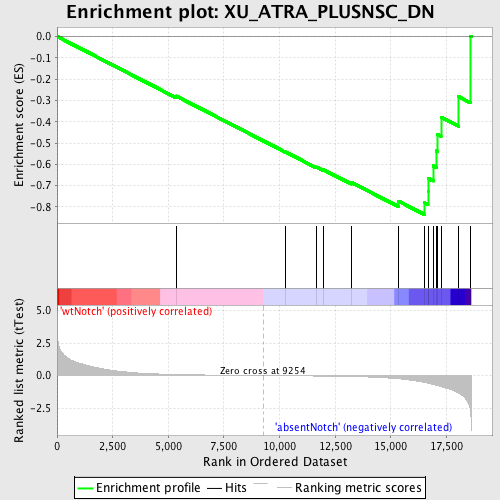
Profile of the Running ES Score & Positions of GeneSet Members on the Rank Ordered List
| Dataset | Set_03_absentNotch_versus_wtNotch.phenotype_absentNotch_versus_wtNotch.cls #wtNotch_versus_absentNotch |
| Phenotype | phenotype_absentNotch_versus_wtNotch.cls#wtNotch_versus_absentNotch |
| Upregulated in class | absentNotch |
| GeneSet | XU_ATRA_PLUSNSC_DN |
| Enrichment Score (ES) | -0.8351642 |
| Normalized Enrichment Score (NES) | -1.6932745 |
| Nominal p-value | 0.0018832391 |
| FDR q-value | 0.105622776 |
| FWER p-Value | 0.644 |
| PROBE | DESCRIPTION (from dataset) | GENE SYMBOL | GENE_TITLE | RANK IN GENE LIST | RANK METRIC SCORE | RUNNING ES | CORE ENRICHMENT | |
|---|---|---|---|---|---|---|---|---|
| 1 | DDX10 | 520746 | 5351 | 0.080 | -0.2793 | No | ||
| 2 | EIF4EBP1 | 60132 5720148 | 10261 | -0.014 | -0.5417 | No | ||
| 3 | GRB10 | 6980082 | 11648 | -0.037 | -0.6124 | No | ||
| 4 | ABCE1 | 4280050 | 11956 | -0.043 | -0.6244 | No | ||
| 5 | APPBP1 | 870707 2120017 | 13220 | -0.077 | -0.6842 | No | ||
| 6 | MYC | 380541 4670170 | 15358 | -0.246 | -0.7734 | No | ||
| 7 | RABGGTB | 3120037 | 16508 | -0.530 | -0.7798 | Yes | ||
| 8 | PPM1G | 610725 | 16672 | -0.586 | -0.7273 | Yes | ||
| 9 | EIF4E | 1580403 70133 6380215 | 16676 | -0.587 | -0.6660 | Yes | ||
| 10 | CSE1L | 3850086 | 16901 | -0.679 | -0.6071 | Yes | ||
| 11 | EIF3S9 | 2030068 2120044 | 17056 | -0.750 | -0.5370 | Yes | ||
| 12 | RUVBL2 | 1190377 | 17097 | -0.768 | -0.4589 | Yes | ||
| 13 | PRMT1 | 2850050 | 17257 | -0.845 | -0.3791 | Yes | ||
| 14 | EIF3S8 | 4230671 4280373 | 18036 | -1.328 | -0.2821 | Yes | ||
| 15 | DDX18 | 6980619 | 18586 | -2.998 | 0.0016 | Yes |

