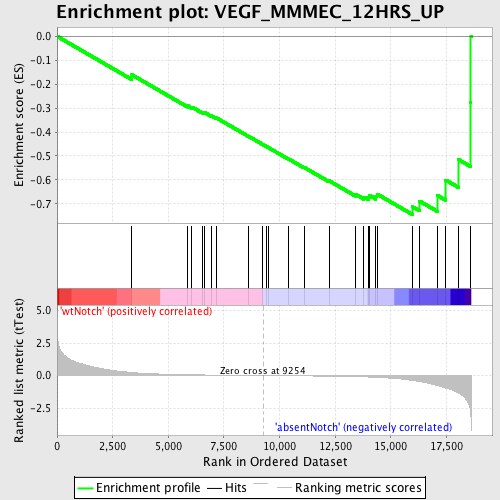
Profile of the Running ES Score & Positions of GeneSet Members on the Rank Ordered List
| Dataset | Set_03_absentNotch_versus_wtNotch.phenotype_absentNotch_versus_wtNotch.cls #wtNotch_versus_absentNotch |
| Phenotype | phenotype_absentNotch_versus_wtNotch.cls#wtNotch_versus_absentNotch |
| Upregulated in class | absentNotch |
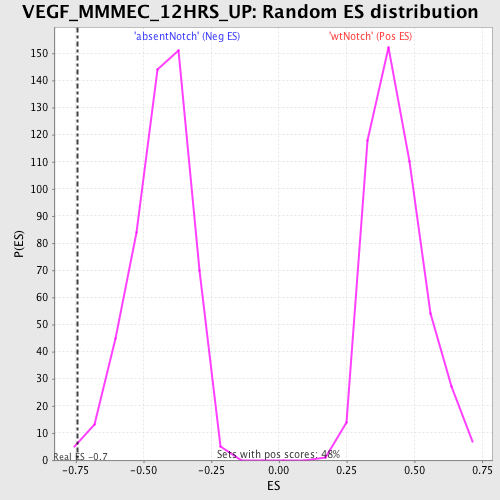
| GeneSet | VEGF_MMMEC_12HRS_UP |
| Enrichment Score (ES) | -0.7443675 |
| Normalized Enrichment Score (NES) | -1.7073677 |
| Nominal p-value | 0.007736944 |
| FDR q-value | 0.08842806 |
| FWER p-Value | 0.552 |
| PROBE | DESCRIPTION (from dataset) | GENE SYMBOL | GENE_TITLE | RANK IN GENE LIST | RANK METRIC SCORE | RUNNING ES | CORE ENRICHMENT | |
|---|---|---|---|---|---|---|---|---|
| 1 | DIRC2 | 2810494 | 3362 | 0.230 | -0.1607 | No | ||
| 2 | FUCA1 | 610075 | 5868 | 0.062 | -0.2901 | No | ||
| 3 | ANKRD1 | 4850685 | 6062 | 0.056 | -0.2955 | No | ||
| 4 | UBD | 5570632 | 6533 | 0.045 | -0.3169 | No | ||
| 5 | COL6A3 | 2640717 4070064 5390717 | 6627 | 0.043 | -0.3182 | No | ||
| 6 | AQP7 | 2760576 2810072 2940722 | 6947 | 0.036 | -0.3322 | No | ||
| 7 | SGCE | 6840075 | 7164 | 0.032 | -0.3410 | No | ||
| 8 | GEM | 5290082 | 8599 | 0.009 | -0.4174 | No | ||
| 9 | IGFBP3 | 2370500 | 9225 | 0.000 | -0.4510 | No | ||
| 10 | FGFBP1 | 5910441 | 9408 | -0.002 | -0.4606 | No | ||
| 11 | TFPI2 | 3870324 | 9479 | -0.003 | -0.4641 | No | ||
| 12 | MEST | 4780440 6620292 | 10416 | -0.016 | -0.5130 | No | ||
| 13 | SULT1E1 | 3140372 | 11103 | -0.027 | -0.5475 | No | ||
| 14 | SP3 | 3840338 | 12229 | -0.049 | -0.6037 | No | ||
| 15 | NNMT | 450471 | 13415 | -0.085 | -0.6600 | No | ||
| 16 | THY1 | 5910162 | 13792 | -0.101 | -0.6714 | No | ||
| 17 | BGN | 4730176 | 14007 | -0.113 | -0.6730 | No | ||
| 18 | CCL2 | 4760019 | 14048 | -0.116 | -0.6650 | No | ||
| 19 | SAT1 | 4570463 | 14329 | -0.134 | -0.6683 | No | ||
| 20 | ELN | 5080347 | 14378 | -0.138 | -0.6588 | No | ||
| 21 | COL1A2 | 380364 | 15969 | -0.373 | -0.7117 | Yes | ||
| 22 | MGP | 6900736 | 16300 | -0.465 | -0.6888 | Yes | ||
| 23 | MMP2 | 2570603 | 17090 | -0.762 | -0.6646 | Yes | ||
| 24 | RHOB | 1500309 | 17468 | -0.964 | -0.6006 | Yes | ||
| 25 | SLC6A8 | 3940341 | 18038 | -1.330 | -0.5148 | Yes | ||
| 26 | SDC4 | 6370411 | 18590 | -3.068 | -0.2760 | Yes | ||
| 27 | VCAM1 | 2900450 | 18602 | -3.170 | 0.0008 | Yes |