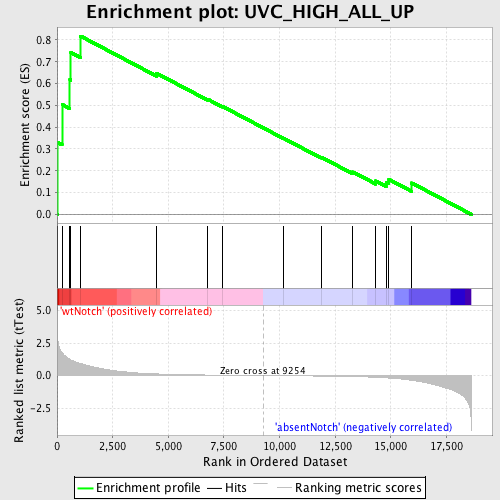
Profile of the Running ES Score & Positions of GeneSet Members on the Rank Ordered List
| Dataset | Set_03_absentNotch_versus_wtNotch.phenotype_absentNotch_versus_wtNotch.cls #wtNotch_versus_absentNotch |
| Phenotype | phenotype_absentNotch_versus_wtNotch.cls#wtNotch_versus_absentNotch |
| Upregulated in class | wtNotch |
| GeneSet | UVC_HIGH_ALL_UP |
| Enrichment Score (ES) | 0.8175415 |
| Normalized Enrichment Score (NES) | 1.6607562 |
| Nominal p-value | 0.004255319 |
| FDR q-value | 0.29779914 |
| FWER p-Value | 0.883 |
| PROBE | DESCRIPTION (from dataset) | GENE SYMBOL | GENE_TITLE | RANK IN GENE LIST | RANK METRIC SCORE | RUNNING ES | CORE ENRICHMENT | |
|---|---|---|---|---|---|---|---|---|
| 1 | FSTL3 | 5420279 | 11 | 3.112 | 0.3303 | Yes | ||
| 2 | ISG15 | 3170093 | 224 | 1.740 | 0.5039 | Yes | ||
| 3 | TCEB2 | 840204 1340400 1450082 | 575 | 1.241 | 0.6171 | Yes | ||
| 4 | RRAD | 4280129 | 618 | 1.201 | 0.7426 | Yes | ||
| 5 | LRBA | 3450402 | 1054 | 0.925 | 0.8175 | Yes | ||
| 6 | COL13A1 | 4120079 | 4473 | 0.124 | 0.6470 | No | ||
| 7 | HBEGF | 2030156 | 6759 | 0.040 | 0.5284 | No | ||
| 8 | IL11 | 1740398 | 7433 | 0.027 | 0.4951 | No | ||
| 9 | PMAIP1 | 1400717 5360047 5900039 | 10176 | -0.013 | 0.3491 | No | ||
| 10 | HTR6 | 4850022 | 11865 | -0.041 | 0.2627 | No | ||
| 11 | MMP3 | 2650368 2970056 | 13295 | -0.080 | 0.1944 | No | ||
| 12 | SAT1 | 4570463 | 14329 | -0.134 | 0.1532 | No | ||
| 13 | ATF3 | 1940546 | 14794 | -0.173 | 0.1467 | No | ||
| 14 | GADD45A | 2900717 | 14912 | -0.188 | 0.1604 | No | ||
| 15 | EXOSC7 | 520538 | 15939 | -0.364 | 0.1439 | No |

