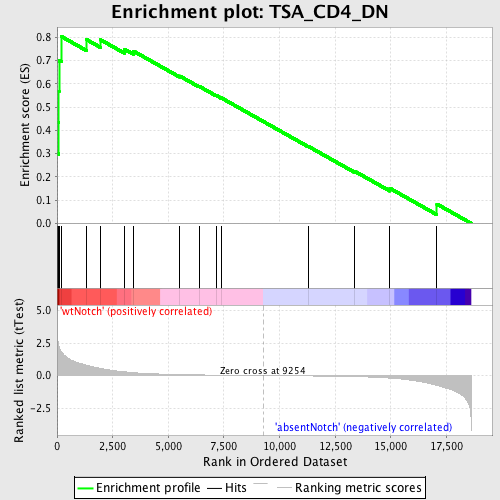
Profile of the Running ES Score & Positions of GeneSet Members on the Rank Ordered List
| Dataset | Set_03_absentNotch_versus_wtNotch.phenotype_absentNotch_versus_wtNotch.cls #wtNotch_versus_absentNotch |
| Phenotype | phenotype_absentNotch_versus_wtNotch.cls#wtNotch_versus_absentNotch |
| Upregulated in class | wtNotch |
| GeneSet | TSA_CD4_DN |
| Enrichment Score (ES) | 0.8030565 |
| Normalized Enrichment Score (NES) | 1.701261 |
| Nominal p-value | 0.0042283298 |
| FDR q-value | 0.7760739 |
| FWER p-Value | 0.674 |
| PROBE | DESCRIPTION (from dataset) | GENE SYMBOL | GENE_TITLE | RANK IN GENE LIST | RANK METRIC SCORE | RUNNING ES | CORE ENRICHMENT | |
|---|---|---|---|---|---|---|---|---|
| 1 | NOTCH1 | 3390114 | 0 | 4.962 | 0.3008 | Yes | ||
| 2 | ICAM1 | 6980138 | 65 | 2.282 | 0.4357 | Yes | ||
| 3 | CD3D | 2810739 | 82 | 2.201 | 0.5683 | Yes | ||
| 4 | IL2RA | 6620450 | 90 | 2.167 | 0.6993 | Yes | ||
| 5 | SLC3A2 | 5270358 | 195 | 1.804 | 0.8031 | Yes | ||
| 6 | CD3E | 3800056 | 1328 | 0.783 | 0.7896 | No | ||
| 7 | LAT | 3170025 | 1959 | 0.545 | 0.7888 | No | ||
| 8 | METAP2 | 1570441 4010026 4850204 | 3020 | 0.285 | 0.7491 | No | ||
| 9 | FGF18 | 1410168 2190706 | 3424 | 0.222 | 0.7409 | No | ||
| 10 | NOTCH2 | 2570397 | 5506 | 0.074 | 0.6335 | No | ||
| 11 | RARB | 430139 1410138 | 6383 | 0.048 | 0.5893 | No | ||
| 12 | WNT7A | 1170315 | 7150 | 0.032 | 0.5501 | No | ||
| 13 | ENTPD2 | 4590739 | 7370 | 0.028 | 0.5400 | No | ||
| 14 | WNT4 | 4150619 | 11291 | -0.030 | 0.3311 | No | ||
| 15 | OGDH | 3840333 6350100 | 13385 | -0.084 | 0.2236 | No | ||
| 16 | CD247 | 3800725 5720136 | 14958 | -0.193 | 0.1508 | No | ||
| 17 | CX3CR1 | 1690577 | 17071 | -0.755 | 0.0831 | No |

