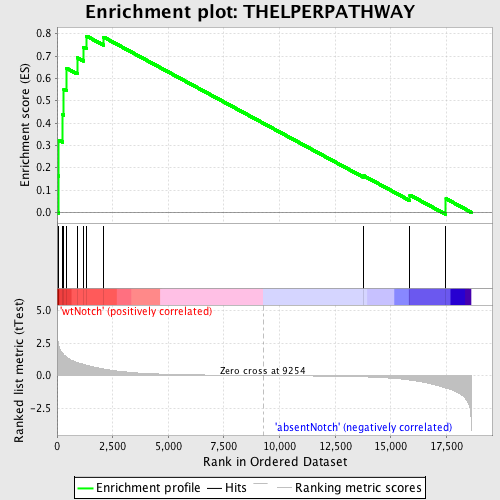
Profile of the Running ES Score & Positions of GeneSet Members on the Rank Ordered List
| Dataset | Set_03_absentNotch_versus_wtNotch.phenotype_absentNotch_versus_wtNotch.cls #wtNotch_versus_absentNotch |
| Phenotype | phenotype_absentNotch_versus_wtNotch.cls#wtNotch_versus_absentNotch |
| Upregulated in class | wtNotch |
| GeneSet | THELPERPATHWAY |
| Enrichment Score (ES) | 0.78907967 |
| Normalized Enrichment Score (NES) | 1.5369023 |
| Nominal p-value | 0.020618556 |
| FDR q-value | 0.49181813 |
| FWER p-Value | 1.0 |
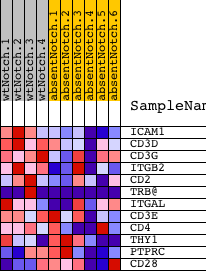
| PROBE | DESCRIPTION (from dataset) | GENE SYMBOL | GENE_TITLE | RANK IN GENE LIST | RANK METRIC SCORE | RUNNING ES | CORE ENRICHMENT | |
|---|---|---|---|---|---|---|---|---|
| 1 | ICAM1 | 6980138 | 65 | 2.282 | 0.1631 | Yes | ||
| 2 | CD3D | 2810739 | 82 | 2.201 | 0.3229 | Yes | ||
| 3 | CD3G | 2680288 | 255 | 1.692 | 0.4372 | Yes | ||
| 4 | ITGB2 | 6380348 | 303 | 1.590 | 0.5507 | Yes | ||
| 5 | CD2 | 430672 | 433 | 1.387 | 0.6450 | Yes | ||
| 6 | TRB@ | 3940292 | 905 | 1.000 | 0.6927 | Yes | ||
| 7 | ITGAL | 1450324 | 1192 | 0.848 | 0.7392 | Yes | ||
| 8 | CD3E | 3800056 | 1328 | 0.783 | 0.7891 | Yes | ||
| 9 | CD4 | 1090010 | 2087 | 0.501 | 0.7849 | No | ||
| 10 | THY1 | 5910162 | 13792 | -0.101 | 0.1632 | No | ||
| 11 | PTPRC | 130402 5290148 | 15857 | -0.346 | 0.0775 | No | ||
| 12 | CD28 | 1400739 4210093 | 17479 | -0.969 | 0.0611 | No |