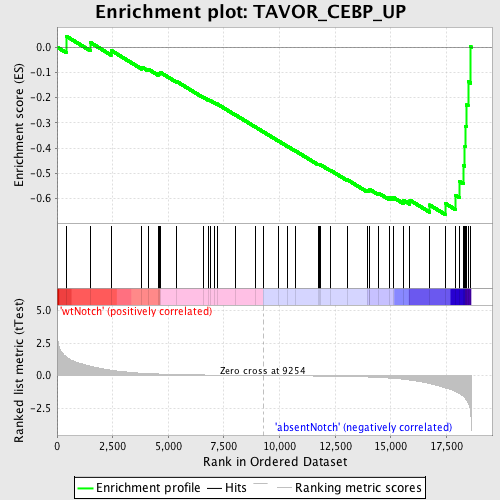
Profile of the Running ES Score & Positions of GeneSet Members on the Rank Ordered List
| Dataset | Set_03_absentNotch_versus_wtNotch.phenotype_absentNotch_versus_wtNotch.cls #wtNotch_versus_absentNotch |
| Phenotype | phenotype_absentNotch_versus_wtNotch.cls#wtNotch_versus_absentNotch |
| Upregulated in class | absentNotch |
| GeneSet | TAVOR_CEBP_UP |
| Enrichment Score (ES) | -0.66279006 |
| Normalized Enrichment Score (NES) | -1.661146 |
| Nominal p-value | 0.0 |
| FDR q-value | 0.1508501 |
| FWER p-Value | 0.841 |
| PROBE | DESCRIPTION (from dataset) | GENE SYMBOL | GENE_TITLE | RANK IN GENE LIST | RANK METRIC SCORE | RUNNING ES | CORE ENRICHMENT | |
|---|---|---|---|---|---|---|---|---|
| 1 | GCH1 | 670364 6550358 | 410 | 1.422 | 0.0437 | No | ||
| 2 | SOD2 | 1410053 | 1493 | 0.717 | 0.0186 | No | ||
| 3 | DYNLT3 | 5570398 | 2427 | 0.406 | -0.0129 | No | ||
| 4 | ARC | 4610093 | 3804 | 0.180 | -0.0786 | No | ||
| 5 | ACSL1 | 2900520 | 4086 | 0.154 | -0.0867 | No | ||
| 6 | NFIL3 | 4070377 | 4541 | 0.120 | -0.1056 | No | ||
| 7 | CD7 | 3140465 | 4586 | 0.117 | -0.1025 | No | ||
| 8 | SECTM1 | 510541 | 4658 | 0.114 | -0.1011 | No | ||
| 9 | ANXA1 | 2320053 | 5372 | 0.079 | -0.1358 | No | ||
| 10 | GBP1 | 780075 | 6560 | 0.044 | -0.1977 | No | ||
| 11 | PTPN3 | 870369 | 6797 | 0.039 | -0.2086 | No | ||
| 12 | GGH | 4850373 6290152 | 6888 | 0.037 | -0.2117 | No | ||
| 13 | SPINT2 | 2630039 6110519 | 7073 | 0.034 | -0.2200 | No | ||
| 14 | KCNMB1 | 4760139 | 7191 | 0.031 | -0.2249 | No | ||
| 15 | PTX3 | 870309 3520102 | 8005 | 0.018 | -0.2678 | No | ||
| 16 | SERPINI1 | 2940468 | 8919 | 0.004 | -0.3168 | No | ||
| 17 | IL1RN | 2370333 | 9296 | -0.000 | -0.3370 | No | ||
| 18 | EEF1A2 | 2260162 5290086 | 9929 | -0.009 | -0.3706 | No | ||
| 19 | ARG1 | 840707 | 10343 | -0.015 | -0.3921 | No | ||
| 20 | SERTAD2 | 2810673 6840450 | 10704 | -0.021 | -0.4105 | No | ||
| 21 | C3AR1 | 5720131 | 11744 | -0.039 | -0.4647 | No | ||
| 22 | GPR109B | 5550471 | 11775 | -0.039 | -0.4645 | No | ||
| 23 | SERPINF1 | 7040367 | 11826 | -0.040 | -0.4653 | No | ||
| 24 | TRIB1 | 2320435 | 12272 | -0.050 | -0.4870 | No | ||
| 25 | BTG2 | 2350411 | 13033 | -0.071 | -0.5246 | No | ||
| 26 | MLC1 | 2650731 6350670 | 13931 | -0.109 | -0.5679 | No | ||
| 27 | KLF5 | 3840348 | 14022 | -0.115 | -0.5674 | No | ||
| 28 | TANK | 1090020 2060458 2370400 | 14051 | -0.116 | -0.5635 | No | ||
| 29 | RGS2 | 1090736 | 14461 | -0.144 | -0.5789 | No | ||
| 30 | CA2 | 1660113 1660600 | 14945 | -0.192 | -0.5960 | No | ||
| 31 | GLIPR1 | 3360750 | 15117 | -0.211 | -0.5954 | No | ||
| 32 | ARHGEF5 | 3170605 | 15577 | -0.285 | -0.6070 | No | ||
| 33 | PTPRC | 130402 5290148 | 15857 | -0.346 | -0.6060 | No | ||
| 34 | BTG1 | 4200735 6040131 6200133 | 16743 | -0.617 | -0.6251 | Yes | ||
| 35 | S100A9 | 7050528 | 17444 | -0.953 | -0.6187 | Yes | ||
| 36 | CCND2 | 5340167 | 17917 | -1.231 | -0.5872 | Yes | ||
| 37 | AKAP12 | 1450739 | 18094 | -1.383 | -0.5327 | Yes | ||
| 38 | EXTL2 | 5050433 | 18262 | -1.585 | -0.4684 | Yes | ||
| 39 | LST1 | 5420372 | 18328 | -1.714 | -0.3926 | Yes | ||
| 40 | VCL | 4120487 | 18343 | -1.734 | -0.3131 | Yes | ||
| 41 | LITAF | 6940671 | 18397 | -1.886 | -0.2288 | Yes | ||
| 42 | HMOX1 | 1740687 | 18474 | -2.093 | -0.1360 | Yes | ||
| 43 | CXCR4 | 4590519 | 18594 | -3.106 | 0.0012 | Yes |

