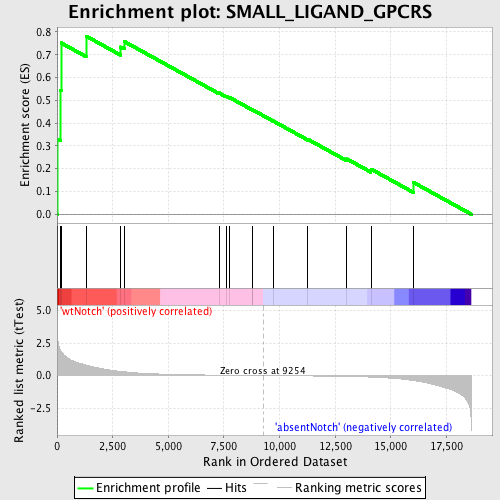
Profile of the Running ES Score & Positions of GeneSet Members on the Rank Ordered List
| Dataset | Set_03_absentNotch_versus_wtNotch.phenotype_absentNotch_versus_wtNotch.cls #wtNotch_versus_absentNotch |
| Phenotype | phenotype_absentNotch_versus_wtNotch.cls#wtNotch_versus_absentNotch |
| Upregulated in class | wtNotch |
| GeneSet | SMALL_LIGAND_GPCRS |
| Enrichment Score (ES) | 0.78167284 |
| Normalized Enrichment Score (NES) | 1.6166428 |
| Nominal p-value | 0.0021881838 |
| FDR q-value | 0.39583084 |
| FWER p-Value | 0.983 |
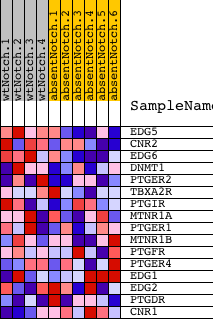
| PROBE | DESCRIPTION (from dataset) | GENE SYMBOL | GENE_TITLE | RANK IN GENE LIST | RANK METRIC SCORE | RUNNING ES | CORE ENRICHMENT | |
|---|---|---|---|---|---|---|---|---|
| 1 | EDG5 | 2640300 | 20 | 2.896 | 0.3294 | Yes | ||
| 2 | CNR2 | 2760398 | 153 | 1.932 | 0.5427 | Yes | ||
| 3 | EDG6 | 2630121 | 181 | 1.845 | 0.7518 | Yes | ||
| 4 | DNMT1 | 2260097 | 1304 | 0.791 | 0.7817 | Yes | ||
| 5 | PTGER2 | 3170039 | 2857 | 0.313 | 0.7339 | No | ||
| 6 | TBXA2R | 2370292 3940066 | 3016 | 0.286 | 0.7581 | No | ||
| 7 | PTGIR | 2100563 | 7276 | 0.030 | 0.5325 | No | ||
| 8 | MTNR1A | 380204 | 7598 | 0.025 | 0.5181 | No | ||
| 9 | PTGER1 | 6100132 | 7750 | 0.022 | 0.5124 | No | ||
| 10 | MTNR1B | 3190341 | 8783 | 0.006 | 0.4577 | No | ||
| 11 | PTGFR | 3850373 | 8797 | 0.006 | 0.4576 | No | ||
| 12 | PTGER4 | 6400670 | 9708 | -0.006 | 0.4094 | No | ||
| 13 | EDG1 | 4200619 | 11272 | -0.030 | 0.3288 | No | ||
| 14 | EDG2 | 6290215 | 13028 | -0.071 | 0.2425 | No | ||
| 15 | PTGDR | 3850161 | 14108 | -0.119 | 0.1981 | No | ||
| 16 | CNR1 | 6550494 6760497 | 16019 | -0.387 | 0.1396 | No |