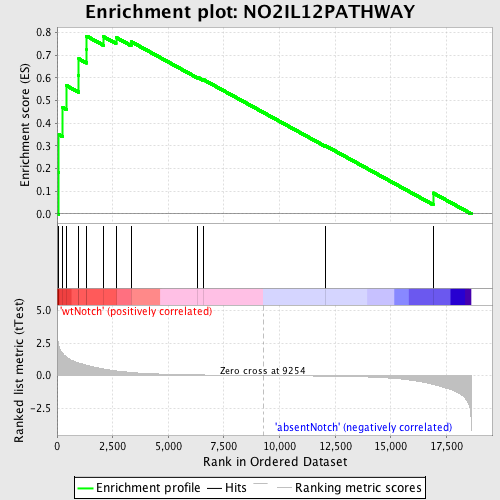
Profile of the Running ES Score & Positions of GeneSet Members on the Rank Ordered List
| Dataset | Set_03_absentNotch_versus_wtNotch.phenotype_absentNotch_versus_wtNotch.cls #wtNotch_versus_absentNotch |
| Phenotype | phenotype_absentNotch_versus_wtNotch.cls#wtNotch_versus_absentNotch |
| Upregulated in class | wtNotch |
| GeneSet | NO2IL12PATHWAY |
| Enrichment Score (ES) | 0.78387487 |
| Normalized Enrichment Score (NES) | 1.6142844 |
| Nominal p-value | 0.004166667 |
| FDR q-value | 0.35516056 |
| FWER p-Value | 0.984 |
| PROBE | DESCRIPTION (from dataset) | GENE SYMBOL | GENE_TITLE | RANK IN GENE LIST | RANK METRIC SCORE | RUNNING ES | CORE ENRICHMENT | |
|---|---|---|---|---|---|---|---|---|
| 1 | TYK2 | 1660465 1740736 | 52 | 2.459 | 0.1841 | Yes | ||
| 2 | CD3D | 2810739 | 82 | 2.201 | 0.3497 | Yes | ||
| 3 | CD3G | 2680288 | 255 | 1.692 | 0.4691 | Yes | ||
| 4 | CD2 | 430672 | 433 | 1.387 | 0.5650 | Yes | ||
| 5 | IL12RB1 | 2230338 5420053 | 964 | 0.975 | 0.6106 | Yes | ||
| 6 | CXCR3 | 6590114 | 977 | 0.969 | 0.6836 | Yes | ||
| 7 | STAT4 | 1660373 3130019 | 1321 | 0.784 | 0.7247 | Yes | ||
| 8 | CD3E | 3800056 | 1328 | 0.783 | 0.7839 | Yes | ||
| 9 | CD4 | 1090010 | 2087 | 0.501 | 0.7812 | No | ||
| 10 | IL12RB2 | 6020465 | 2648 | 0.355 | 0.7781 | No | ||
| 11 | IL12A | 7100551 | 3326 | 0.234 | 0.7595 | No | ||
| 12 | JAK2 | 3780528 6100692 6550577 | 6316 | 0.050 | 0.6026 | No | ||
| 13 | IL12B | 460008 | 6572 | 0.044 | 0.5922 | No | ||
| 14 | IFNG | 5670592 | 12065 | -0.045 | 0.3004 | No | ||
| 15 | CCR5 | 1980072 5910722 | 16904 | -0.681 | 0.0920 | No |

