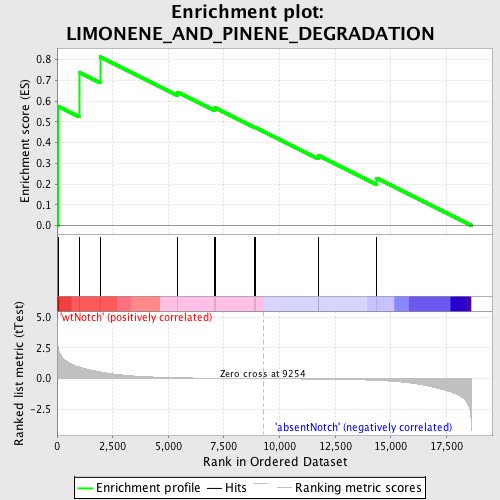
Profile of the Running ES Score & Positions of GeneSet Members on the Rank Ordered List
| Dataset | Set_03_absentNotch_versus_wtNotch.phenotype_absentNotch_versus_wtNotch.cls #wtNotch_versus_absentNotch |
| Phenotype | phenotype_absentNotch_versus_wtNotch.cls#wtNotch_versus_absentNotch |
| Upregulated in class | wtNotch |
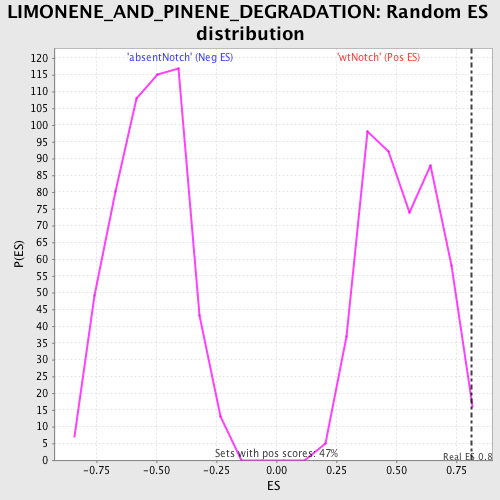
| GeneSet | LIMONENE_AND_PINENE_DEGRADATION |
| Enrichment Score (ES) | 0.8135548 |
| Normalized Enrichment Score (NES) | 1.5553383 |
| Nominal p-value | 0.010683761 |
| FDR q-value | 0.49773175 |
| FWER p-Value | 1.0 |
| PROBE | DESCRIPTION (from dataset) | GENE SYMBOL | GENE_TITLE | RANK IN GENE LIST | RANK METRIC SCORE | RUNNING ES | CORE ENRICHMENT | |
|---|---|---|---|---|---|---|---|---|
| 1 | ALDH1B1 | 610195 | 43 | 2.568 | 0.5751 | Yes | ||
| 2 | ECHS1 | 2970184 | 991 | 0.955 | 0.7390 | Yes | ||
| 3 | ALDH3A1 | 580095 | 1930 | 0.556 | 0.8136 | Yes | ||
| 4 | EHHADH | 6200315 | 5412 | 0.078 | 0.6439 | No | ||
| 5 | ALDH1A2 | 2320301 | 7064 | 0.034 | 0.5629 | No | ||
| 6 | SDS | 110242 6380725 | 7122 | 0.033 | 0.5672 | No | ||
| 7 | HADHA | 3190041 | 8877 | 0.005 | 0.4740 | No | ||
| 8 | ALDH1A1 | 6520706 | 8936 | 0.004 | 0.4719 | No | ||
| 9 | ALDH1A3 | 2100270 | 11734 | -0.038 | 0.3301 | No | ||
| 10 | ALDH9A1 | 4810047 | 11752 | -0.039 | 0.3379 | No | ||
| 11 | ALDH2 | 4230019 | 14370 | -0.138 | 0.2282 | No |