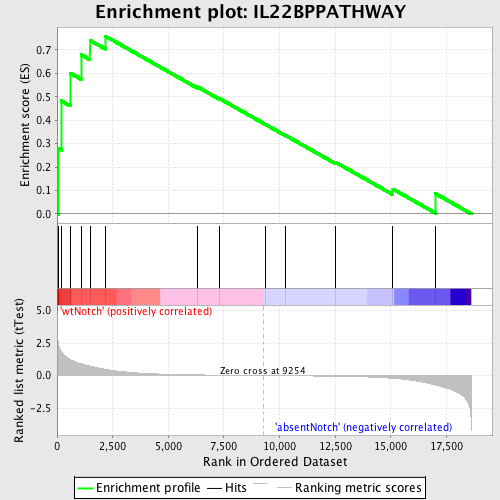
Profile of the Running ES Score & Positions of GeneSet Members on the Rank Ordered List
| Dataset | Set_03_absentNotch_versus_wtNotch.phenotype_absentNotch_versus_wtNotch.cls #wtNotch_versus_absentNotch |
| Phenotype | phenotype_absentNotch_versus_wtNotch.cls#wtNotch_versus_absentNotch |
| Upregulated in class | wtNotch |
| GeneSet | IL22BPPATHWAY |
| Enrichment Score (ES) | 0.7590678 |
| Normalized Enrichment Score (NES) | 1.5159183 |
| Nominal p-value | 0.034408603 |
| FDR q-value | 0.51585543 |
| FWER p-Value | 1.0 |
| PROBE | DESCRIPTION (from dataset) | GENE SYMBOL | GENE_TITLE | RANK IN GENE LIST | RANK METRIC SCORE | RUNNING ES | CORE ENRICHMENT | |
|---|---|---|---|---|---|---|---|---|
| 1 | TYK2 | 1660465 1740736 | 52 | 2.459 | 0.2796 | Yes | ||
| 2 | JAK3 | 70347 3290008 | 187 | 1.829 | 0.4825 | Yes | ||
| 3 | SOCS3 | 5550563 | 593 | 1.220 | 0.6008 | Yes | ||
| 4 | STAT5A | 2680458 | 1078 | 0.913 | 0.6796 | Yes | ||
| 5 | STAT1 | 6510204 6590553 | 1478 | 0.723 | 0.7412 | Yes | ||
| 6 | STAT3 | 460040 3710341 | 2171 | 0.480 | 0.7591 | Yes | ||
| 7 | JAK2 | 3780528 6100692 6550577 | 6316 | 0.050 | 0.5420 | No | ||
| 8 | STAT5B | 6200026 | 7297 | 0.029 | 0.4927 | No | ||
| 9 | IL22 | 1660102 | 9387 | -0.002 | 0.3806 | No | ||
| 10 | IL22RA1 | 5720603 | 10274 | -0.014 | 0.3346 | No | ||
| 11 | IL22RA2 | 460113 | 12502 | -0.055 | 0.2213 | No | ||
| 12 | JAK1 | 5910746 | 15095 | -0.209 | 0.1059 | No | ||
| 13 | IL10RA | 1770164 | 17010 | -0.725 | 0.0863 | No |

