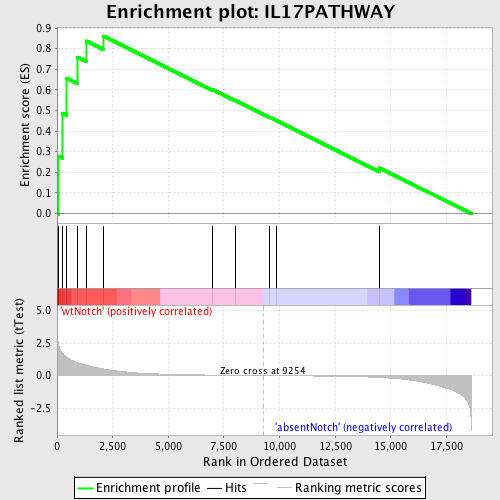
Profile of the Running ES Score & Positions of GeneSet Members on the Rank Ordered List
| Dataset | Set_03_absentNotch_versus_wtNotch.phenotype_absentNotch_versus_wtNotch.cls #wtNotch_versus_absentNotch |
| Phenotype | phenotype_absentNotch_versus_wtNotch.cls#wtNotch_versus_absentNotch |
| Upregulated in class | wtNotch |
| GeneSet | IL17PATHWAY |
| Enrichment Score (ES) | 0.86064273 |
| Normalized Enrichment Score (NES) | 1.6214232 |
| Nominal p-value | 0.0 |
| FDR q-value | 0.43508074 |
| FWER p-Value | 0.978 |
| PROBE | DESCRIPTION (from dataset) | GENE SYMBOL | GENE_TITLE | RANK IN GENE LIST | RANK METRIC SCORE | RUNNING ES | CORE ENRICHMENT | |
|---|---|---|---|---|---|---|---|---|
| 1 | CD3D | 2810739 | 82 | 2.201 | 0.2786 | Yes | ||
| 2 | CD3G | 2680288 | 255 | 1.692 | 0.4869 | Yes | ||
| 3 | CD2 | 430672 | 433 | 1.387 | 0.6558 | Yes | ||
| 4 | TRB@ | 3940292 | 905 | 1.000 | 0.7590 | Yes | ||
| 5 | CD3E | 3800056 | 1328 | 0.783 | 0.8370 | Yes | ||
| 6 | CD4 | 1090010 | 2087 | 0.501 | 0.8606 | Yes | ||
| 7 | CD34 | 6650270 | 6970 | 0.036 | 0.6029 | No | ||
| 8 | KITLG | 2120047 6220300 | 8023 | 0.018 | 0.5486 | No | ||
| 9 | IL3 | 2480280 | 9533 | -0.004 | 0.4680 | No | ||
| 10 | IL6 | 380133 | 9878 | -0.009 | 0.4506 | No | ||
| 11 | CSF3 | 2230193 6660707 | 14501 | -0.148 | 0.2212 | No |

