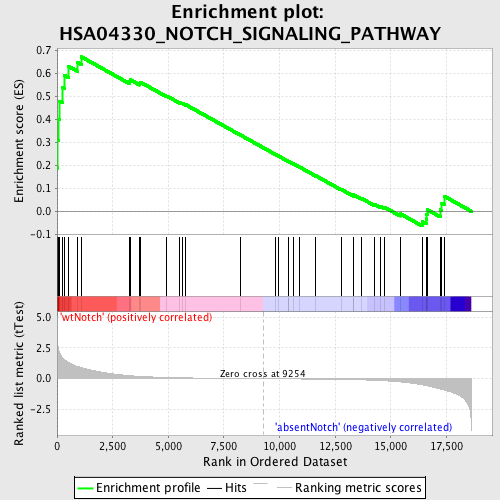
Profile of the Running ES Score & Positions of GeneSet Members on the Rank Ordered List
| Dataset | Set_03_absentNotch_versus_wtNotch.phenotype_absentNotch_versus_wtNotch.cls #wtNotch_versus_absentNotch |
| Phenotype | phenotype_absentNotch_versus_wtNotch.cls#wtNotch_versus_absentNotch |
| Upregulated in class | wtNotch |
| GeneSet | HSA04330_NOTCH_SIGNALING_PATHWAY |
| Enrichment Score (ES) | 0.6708256 |
| Normalized Enrichment Score (NES) | 1.7006183 |
| Nominal p-value | 0.0020661156 |
| FDR q-value | 0.39181623 |
| FWER p-Value | 0.676 |
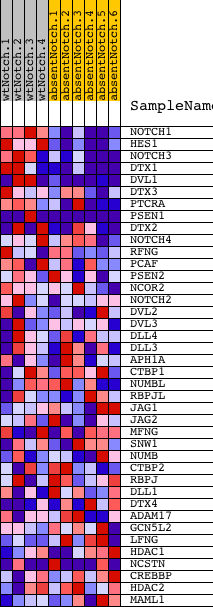
| PROBE | DESCRIPTION (from dataset) | GENE SYMBOL | GENE_TITLE | RANK IN GENE LIST | RANK METRIC SCORE | RUNNING ES | CORE ENRICHMENT | |
|---|---|---|---|---|---|---|---|---|
| 1 | NOTCH1 | 3390114 | 0 | 4.962 | 0.1883 | Yes | ||
| 2 | HES1 | 4810280 | 10 | 3.181 | 0.3085 | Yes | ||
| 3 | NOTCH3 | 3060603 | 51 | 2.482 | 0.4005 | Yes | ||
| 4 | DTX1 | 5900372 | 95 | 2.127 | 0.4789 | Yes | ||
| 5 | DVL1 | 5900450 6510162 | 232 | 1.731 | 0.5373 | Yes | ||
| 6 | DTX3 | 1690458 | 340 | 1.524 | 0.5893 | Yes | ||
| 7 | PTCRA | 6940142 | 501 | 1.310 | 0.6304 | Yes | ||
| 8 | PSEN1 | 130403 2030647 6100603 | 922 | 0.996 | 0.6456 | Yes | ||
| 9 | DTX2 | 4210041 7000008 | 1091 | 0.904 | 0.6708 | Yes | ||
| 10 | NOTCH4 | 2450040 6370707 | 3248 | 0.246 | 0.5641 | No | ||
| 11 | RFNG | 6290086 | 3279 | 0.242 | 0.5716 | No | ||
| 12 | PCAF | 2230161 2570369 6550451 | 3710 | 0.188 | 0.5556 | No | ||
| 13 | PSEN2 | 130382 | 3736 | 0.186 | 0.5613 | No | ||
| 14 | NCOR2 | 1980575 6550050 | 4938 | 0.098 | 0.5004 | No | ||
| 15 | NOTCH2 | 2570397 | 5506 | 0.074 | 0.4727 | No | ||
| 16 | DVL2 | 6110162 | 5617 | 0.070 | 0.4694 | No | ||
| 17 | DVL3 | 360156 5390075 | 5791 | 0.064 | 0.4625 | No | ||
| 18 | DLL4 | 6400403 | 8253 | 0.014 | 0.3306 | No | ||
| 19 | DLL3 | 4010093 | 9826 | -0.008 | 0.2463 | No | ||
| 20 | APH1A | 4060273 4670465 6450711 | 9932 | -0.009 | 0.2410 | No | ||
| 21 | CTBP1 | 3780315 | 10417 | -0.016 | 0.2156 | No | ||
| 22 | NUMBL | 6130360 6200333 | 10421 | -0.016 | 0.2160 | No | ||
| 23 | RBPJL | 5390019 | 10603 | -0.019 | 0.2070 | No | ||
| 24 | JAG1 | 3440390 | 10896 | -0.024 | 0.1922 | No | ||
| 25 | JAG2 | 1500341 | 11635 | -0.036 | 0.1538 | No | ||
| 26 | MFNG | 1770242 4280348 | 12767 | -0.063 | 0.0953 | No | ||
| 27 | SNW1 | 4010736 | 13319 | -0.081 | 0.0688 | No | ||
| 28 | NUMB | 2450735 3800253 6350040 | 13320 | -0.081 | 0.0718 | No | ||
| 29 | CTBP2 | 430309 3710079 | 13665 | -0.095 | 0.0569 | No | ||
| 30 | RBPJ | 2360164 5550136 5720402 | 14258 | -0.130 | 0.0300 | No | ||
| 31 | DLL1 | 1770377 | 14531 | -0.150 | 0.0210 | No | ||
| 32 | DTX4 | 4120433 | 14710 | -0.166 | 0.0178 | No | ||
| 33 | ADAM17 | 360292 | 15422 | -0.257 | -0.0108 | No | ||
| 34 | GCN5L2 | 2340609 | 16408 | -0.497 | -0.0449 | No | ||
| 35 | LFNG | 5360711 | 16588 | -0.557 | -0.0334 | No | ||
| 36 | HDAC1 | 2850670 | 16596 | -0.560 | -0.0126 | No | ||
| 37 | NCSTN | 940601 6400594 | 16642 | -0.574 | 0.0068 | No | ||
| 38 | CREBBP | 5690035 7040050 | 17223 | -0.828 | 0.0070 | No | ||
| 39 | HDAC2 | 4050433 | 17296 | -0.861 | 0.0358 | No | ||
| 40 | MAML1 | 2760008 | 17404 | -0.928 | 0.0652 | No |