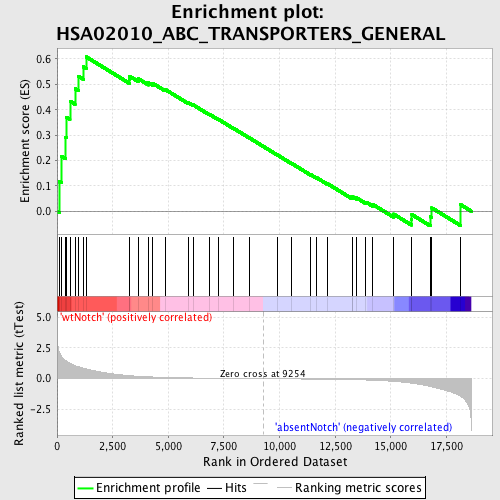
Profile of the Running ES Score & Positions of GeneSet Members on the Rank Ordered List
| Dataset | Set_03_absentNotch_versus_wtNotch.phenotype_absentNotch_versus_wtNotch.cls #wtNotch_versus_absentNotch |
| Phenotype | phenotype_absentNotch_versus_wtNotch.cls#wtNotch_versus_absentNotch |
| Upregulated in class | wtNotch |
| GeneSet | HSA02010_ABC_TRANSPORTERS_GENERAL |
| Enrichment Score (ES) | 0.6084519 |
| Normalized Enrichment Score (NES) | 1.5457889 |
| Nominal p-value | 0.017660044 |
| FDR q-value | 0.47463572 |
| FWER p-Value | 1.0 |

| PROBE | DESCRIPTION (from dataset) | GENE SYMBOL | GENE_TITLE | RANK IN GENE LIST | RANK METRIC SCORE | RUNNING ES | CORE ENRICHMENT | |
|---|---|---|---|---|---|---|---|---|
| 1 | ABCD1 | 5670373 | 104 | 2.104 | 0.1163 | Yes | ||
| 2 | ABCB6 | 6350138 | 189 | 1.826 | 0.2176 | Yes | ||
| 3 | ABCB10 | 1980242 | 383 | 1.464 | 0.2921 | Yes | ||
| 4 | ABCB9 | 110603 4560592 6110338 | 429 | 1.395 | 0.3705 | Yes | ||
| 5 | TAP2 | 2810347 | 580 | 1.236 | 0.4340 | Yes | ||
| 6 | ABCA2 | 5050039 | 808 | 1.063 | 0.4834 | Yes | ||
| 7 | ABCA7 | 6860022 6900364 | 960 | 0.978 | 0.5319 | Yes | ||
| 8 | TAP1 | 4050047 | 1179 | 0.854 | 0.5697 | Yes | ||
| 9 | ABCB7 | 4150324 | 1308 | 0.788 | 0.6085 | Yes | ||
| 10 | ABCC4 | 130309 | 3251 | 0.246 | 0.5182 | No | ||
| 11 | ABCD3 | 7040341 | 3263 | 0.244 | 0.5317 | No | ||
| 12 | ABCD2 | 4070315 6220162 | 3647 | 0.194 | 0.5224 | No | ||
| 13 | ABCG8 | 4780605 | 4111 | 0.151 | 0.5062 | No | ||
| 14 | ABCC6 | 6900168 | 4288 | 0.137 | 0.5047 | No | ||
| 15 | ABCA3 | 7000746 | 4851 | 0.102 | 0.4804 | No | ||
| 16 | ABCC2 | 380202 5390300 | 5892 | 0.061 | 0.4279 | No | ||
| 17 | ABCA6 | 130538 1050706 | 6109 | 0.055 | 0.4195 | No | ||
| 18 | ABCA5 | 1190372 1660110 4560072 | 6842 | 0.038 | 0.3823 | No | ||
| 19 | CFTR | 1850008 | 7241 | 0.030 | 0.3627 | No | ||
| 20 | ABCG5 | 2810670 | 7943 | 0.019 | 0.3260 | No | ||
| 21 | ABCC12 | 5550026 | 8645 | 0.008 | 0.2888 | No | ||
| 22 | ABCB11 | 7040170 | 9926 | -0.009 | 0.2204 | No | ||
| 23 | ABCA1 | 6290156 | 10521 | -0.018 | 0.1895 | No | ||
| 24 | ABCA12 | 4540156 | 11406 | -0.032 | 0.1438 | No | ||
| 25 | ABCC8 | 2810671 3120671 | 11674 | -0.037 | 0.1316 | No | ||
| 26 | ABCA4 | 2370064 3940711 | 12131 | -0.047 | 0.1097 | No | ||
| 27 | ABCG2 | 6370056 | 13261 | -0.079 | 0.0535 | No | ||
| 28 | ABCC9 | 1090692 2260164 3440113 | 13288 | -0.080 | 0.0567 | No | ||
| 29 | ABCC1 | 4760722 6770280 | 13455 | -0.087 | 0.0528 | No | ||
| 30 | ABCA9 | 2760136 5550706 | 13876 | -0.105 | 0.0363 | No | ||
| 31 | ABCC5 | 2100600 5050692 | 14182 | -0.124 | 0.0271 | No | ||
| 32 | ABCC10 | 580088 1230020 4230307 | 15118 | -0.212 | -0.0109 | No | ||
| 33 | ABCG4 | 3440458 | 15928 | -0.362 | -0.0335 | No | ||
| 34 | ABCB4 | 1440156 | 15943 | -0.365 | -0.0131 | No | ||
| 35 | ABCD4 | 1450164 | 16781 | -0.631 | -0.0216 | No | ||
| 36 | ABCC3 | 4050242 | 16843 | -0.652 | 0.0129 | No | ||
| 37 | ABCG1 | 60692 | 18129 | -1.423 | 0.0262 | No |

