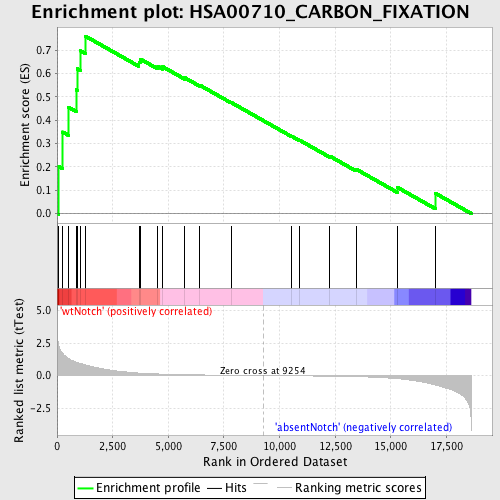
Profile of the Running ES Score & Positions of GeneSet Members on the Rank Ordered List
| Dataset | Set_03_absentNotch_versus_wtNotch.phenotype_absentNotch_versus_wtNotch.cls #wtNotch_versus_absentNotch |
| Phenotype | phenotype_absentNotch_versus_wtNotch.cls#wtNotch_versus_absentNotch |
| Upregulated in class | wtNotch |
| GeneSet | HSA00710_CARBON_FIXATION |
| Enrichment Score (ES) | 0.75953466 |
| Normalized Enrichment Score (NES) | 1.6643571 |
| Nominal p-value | 0.0020533882 |
| FDR q-value | 0.35327446 |
| FWER p-Value | 0.865 |
| PROBE | DESCRIPTION (from dataset) | GENE SYMBOL | GENE_TITLE | RANK IN GENE LIST | RANK METRIC SCORE | RUNNING ES | CORE ENRICHMENT | |
|---|---|---|---|---|---|---|---|---|
| 1 | ALDOA | 6290672 | 72 | 2.228 | 0.2011 | Yes | ||
| 2 | GOT2 | 4570164 5220450 | 244 | 1.711 | 0.3492 | Yes | ||
| 3 | FBP1 | 1470762 | 507 | 1.307 | 0.4553 | Yes | ||
| 4 | PKM2 | 6520403 70500 | 860 | 1.021 | 0.5303 | Yes | ||
| 5 | PGK1 | 1570494 630300 | 902 | 1.000 | 0.6201 | Yes | ||
| 6 | TPI1 | 1500215 2100154 | 1061 | 0.922 | 0.6964 | Yes | ||
| 7 | GOT1 | 2940465 | 1270 | 0.808 | 0.7595 | Yes | ||
| 8 | TKT | 6590064 6860039 | 3680 | 0.191 | 0.6476 | No | ||
| 9 | GPT2 | 1850463 | 3738 | 0.185 | 0.6615 | No | ||
| 10 | RPIA | 780079 | 4528 | 0.121 | 0.6302 | No | ||
| 11 | FBP2 | 1580193 | 4749 | 0.109 | 0.6284 | No | ||
| 12 | MDH1 | 6660358 6760731 | 5747 | 0.065 | 0.5808 | No | ||
| 13 | MDH2 | 1850601 | 6402 | 0.047 | 0.5500 | No | ||
| 14 | PGK2 | 2650091 | 7823 | 0.021 | 0.4756 | No | ||
| 15 | ALDOB | 4730324 | 10535 | -0.018 | 0.3315 | No | ||
| 16 | RPE | 940114 | 10895 | -0.024 | 0.3143 | No | ||
| 17 | PKLR | 1170400 2470114 | 12255 | -0.050 | 0.2458 | No | ||
| 18 | TKTL1 | 2810672 6760102 | 13436 | -0.086 | 0.1903 | No | ||
| 19 | ALDOC | 450121 610427 | 15301 | -0.238 | 0.1119 | No | ||
| 20 | GPT | 2350270 | 16999 | -0.721 | 0.0869 | No |

