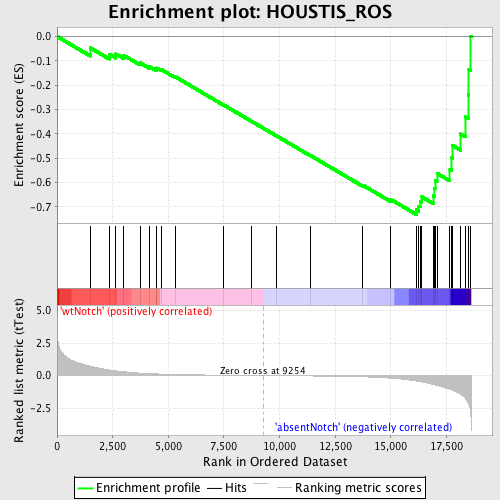
Profile of the Running ES Score & Positions of GeneSet Members on the Rank Ordered List
| Dataset | Set_03_absentNotch_versus_wtNotch.phenotype_absentNotch_versus_wtNotch.cls #wtNotch_versus_absentNotch |
| Phenotype | phenotype_absentNotch_versus_wtNotch.cls#wtNotch_versus_absentNotch |
| Upregulated in class | absentNotch |
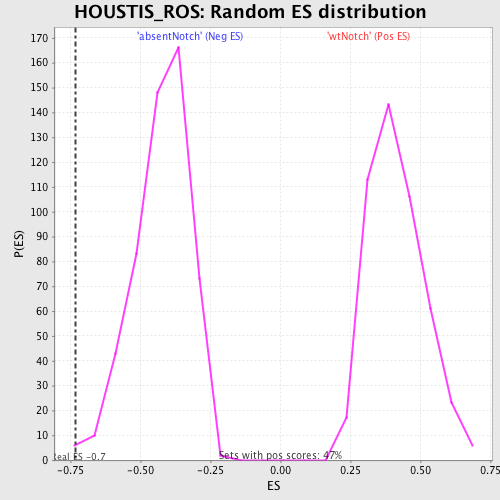
| GeneSet | HOUSTIS_ROS |
| Enrichment Score (ES) | -0.7311636 |
| Normalized Enrichment Score (NES) | -1.7159827 |
| Nominal p-value | 0.0037664783 |
| FDR q-value | 0.090085514 |
| FWER p-Value | 0.491 |
| PROBE | DESCRIPTION (from dataset) | GENE SYMBOL | GENE_TITLE | RANK IN GENE LIST | RANK METRIC SCORE | RUNNING ES | CORE ENRICHMENT | |
|---|---|---|---|---|---|---|---|---|
| 1 | SOD2 | 1410053 | 1493 | 0.717 | -0.0469 | No | ||
| 2 | TXNRD2 | 2510398 3780451 | 2344 | 0.431 | -0.0726 | No | ||
| 3 | SOD1 | 5890070 | 2642 | 0.356 | -0.0720 | No | ||
| 4 | GPX4 | 5080433 | 2999 | 0.288 | -0.0777 | No | ||
| 5 | XDH | 6840446 | 3732 | 0.186 | -0.1084 | No | ||
| 6 | CAT | 4280152 | 4153 | 0.148 | -0.1242 | No | ||
| 7 | GPX3 | 1340450 | 4455 | 0.126 | -0.1345 | No | ||
| 8 | SOD3 | 1410484 | 4471 | 0.125 | -0.1295 | No | ||
| 9 | TXN1 | 1850181 2260041 | 4680 | 0.113 | -0.1354 | No | ||
| 10 | GPX2 | 6940619 | 5326 | 0.081 | -0.1663 | No | ||
| 11 | FTH1 | 3830154 | 7490 | 0.026 | -0.2815 | No | ||
| 12 | PRDX6 | 4920397 6380601 | 8731 | 0.007 | -0.3479 | No | ||
| 13 | GPX5 | 4200397 5690739 | 9839 | -0.008 | -0.4071 | No | ||
| 14 | CP | 2570484 | 11373 | -0.031 | -0.4881 | No | ||
| 15 | HPXN | 3440114 | 13737 | -0.099 | -0.6107 | No | ||
| 16 | TXNRD1 | 6590446 | 14999 | -0.198 | -0.6693 | No | ||
| 17 | MT2A | 6860286 | 16150 | -0.419 | -0.7117 | Yes | ||
| 18 | HMOX2 | 6100193 | 16259 | -0.450 | -0.6965 | Yes | ||
| 19 | FTL1 | 5670594 | 16316 | -0.470 | -0.6776 | Yes | ||
| 20 | TXN2 | 2030402 | 16392 | -0.493 | -0.6586 | Yes | ||
| 21 | HP | 2940551 6350068 | 16913 | -0.685 | -0.6547 | Yes | ||
| 22 | MT1A | 4850164 | 16952 | -0.699 | -0.6242 | Yes | ||
| 23 | PRDX3 | 1690035 | 16991 | -0.717 | -0.5928 | Yes | ||
| 24 | PRDX4 | 3800039 | 17076 | -0.758 | -0.5620 | Yes | ||
| 25 | GLRX2 | 940433 | 17656 | -1.041 | -0.5447 | Yes | ||
| 26 | GCLM | 4230270 | 17740 | -1.098 | -0.4980 | Yes | ||
| 27 | CYP1B1 | 4760735 | 17768 | -1.118 | -0.4473 | Yes | ||
| 28 | PRDX1 | 5720253 | 18130 | -1.423 | -0.4005 | Yes | ||
| 29 | GPX1 | 4150093 | 18354 | -1.759 | -0.3305 | Yes | ||
| 30 | HMOX1 | 1740687 | 18474 | -2.093 | -0.2394 | Yes | ||
| 31 | PRDX2 | 6760095 4010619 5340577 | 18508 | -2.230 | -0.1372 | Yes | ||
| 32 | SDC4 | 6370411 | 18590 | -3.068 | 0.0014 | Yes |