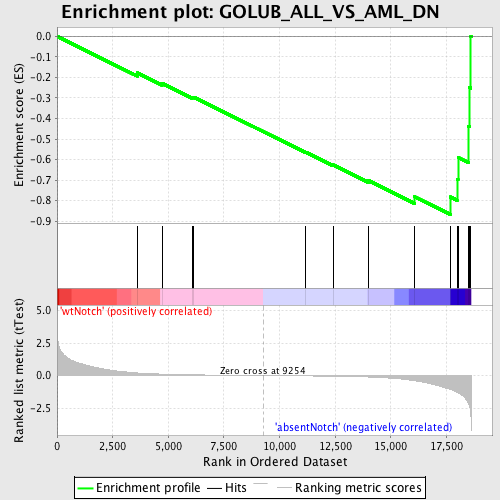
Profile of the Running ES Score & Positions of GeneSet Members on the Rank Ordered List
| Dataset | Set_03_absentNotch_versus_wtNotch.phenotype_absentNotch_versus_wtNotch.cls #wtNotch_versus_absentNotch |
| Phenotype | phenotype_absentNotch_versus_wtNotch.cls#wtNotch_versus_absentNotch |
| Upregulated in class | absentNotch |
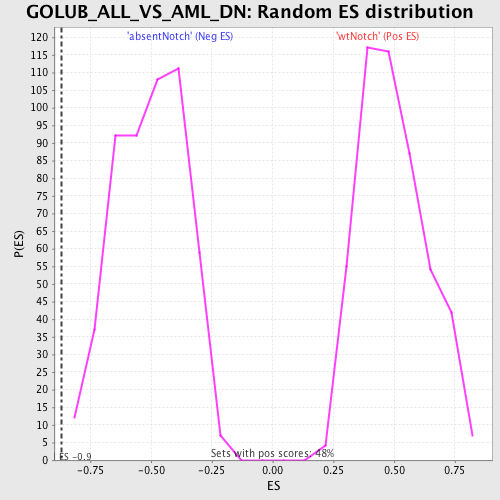
| GeneSet | GOLUB_ALL_VS_AML_DN |
| Enrichment Score (ES) | -0.86705106 |
| Normalized Enrichment Score (NES) | -1.7272817 |
| Nominal p-value | 0.0 |
| FDR q-value | 0.0836011 |
| FWER p-Value | 0.421 |
| PROBE | DESCRIPTION (from dataset) | GENE SYMBOL | GENE_TITLE | RANK IN GENE LIST | RANK METRIC SCORE | RUNNING ES | CORE ENRICHMENT | |
|---|---|---|---|---|---|---|---|---|
| 1 | ATP6V0C | 1780609 | 3600 | 0.199 | -0.1773 | No | ||
| 2 | HOXA9 | 610494 4730040 5130601 | 4718 | 0.111 | -0.2283 | No | ||
| 3 | LYN | 6040600 | 6066 | 0.056 | -0.2962 | No | ||
| 4 | ZYX | 4730068 | 6140 | 0.055 | -0.2957 | No | ||
| 5 | CFD | 2320736 | 11161 | -0.028 | -0.5632 | No | ||
| 6 | CD33 | 3990735 | 12408 | -0.053 | -0.6259 | No | ||
| 7 | PPIF | 1740059 | 13995 | -0.113 | -0.7020 | No | ||
| 8 | SQSTM1 | 6550056 | 16068 | -0.399 | -0.7809 | No | ||
| 9 | MCL1 | 1660672 | 17671 | -1.051 | -0.7816 | Yes | ||
| 10 | CTSD | 1070195 | 17981 | -1.275 | -0.6946 | Yes | ||
| 11 | NFKBIA | 1570152 | 18024 | -1.317 | -0.5899 | Yes | ||
| 12 | FAH | 5390195 | 18497 | -2.200 | -0.4365 | Yes | ||
| 13 | CST3 | 7050452 | 18535 | -2.325 | -0.2495 | Yes | ||
| 14 | LEPROT | 5130450 | 18596 | -3.124 | 0.0011 | Yes |