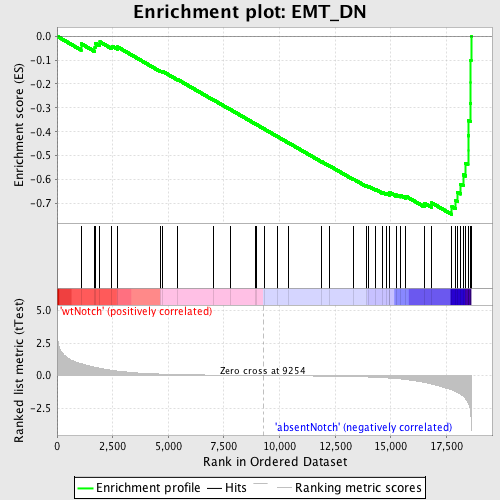
Profile of the Running ES Score & Positions of GeneSet Members on the Rank Ordered List
| Dataset | Set_03_absentNotch_versus_wtNotch.phenotype_absentNotch_versus_wtNotch.cls #wtNotch_versus_absentNotch |
| Phenotype | phenotype_absentNotch_versus_wtNotch.cls#wtNotch_versus_absentNotch |
| Upregulated in class | absentNotch |
| GeneSet | EMT_DN |
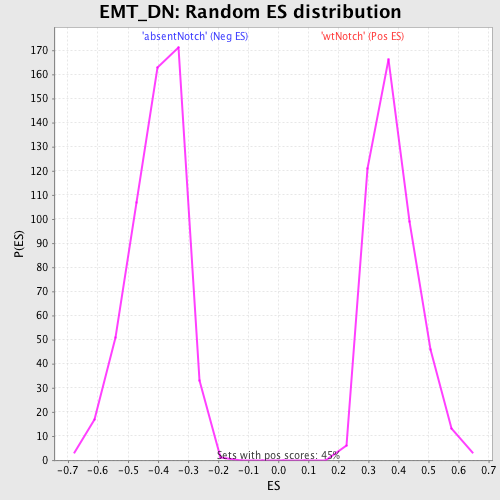
| Enrichment Score (ES) | -0.74647015 |
| Normalized Enrichment Score (NES) | -1.8426065 |
| Nominal p-value | 0.0 |
| FDR q-value | 0.013241797 |
| FWER p-Value | 0.041 |
| PROBE | DESCRIPTION (from dataset) | GENE SYMBOL | GENE_TITLE | RANK IN GENE LIST | RANK METRIC SCORE | RUNNING ES | CORE ENRICHMENT | |
|---|---|---|---|---|---|---|---|---|
| 1 | STAT5A | 2680458 | 1078 | 0.913 | -0.0313 | No | ||
| 2 | MYH9 | 3120091 4850292 | 1700 | 0.628 | -0.0463 | No | ||
| 3 | ATP1A1 | 5670451 | 1711 | 0.623 | -0.0286 | No | ||
| 4 | EGR1 | 4610347 | 1925 | 0.558 | -0.0237 | No | ||
| 5 | TGFB3 | 1070041 | 2466 | 0.396 | -0.0412 | No | ||
| 6 | CHKA | 510324 | 2718 | 0.340 | -0.0447 | No | ||
| 7 | THBS1 | 4560494 430288 | 4657 | 0.114 | -0.1458 | No | ||
| 8 | FBP2 | 1580193 | 4749 | 0.109 | -0.1475 | No | ||
| 9 | ARHGEF1 | 610347 4850603 6420672 | 5421 | 0.077 | -0.1813 | No | ||
| 10 | KLF10 | 4850056 | 7040 | 0.034 | -0.2674 | No | ||
| 11 | FOSB | 1940142 | 7798 | 0.021 | -0.3076 | No | ||
| 12 | TACSTD1 | 3780025 | 8894 | 0.005 | -0.3664 | No | ||
| 13 | TSC22D1 | 1340739 6040181 | 8962 | 0.004 | -0.3699 | No | ||
| 14 | RARA | 4050161 | 9330 | -0.001 | -0.3896 | No | ||
| 15 | F3 | 2940180 | 9901 | -0.009 | -0.4201 | No | ||
| 16 | PKP1 | 1500433 | 10414 | -0.016 | -0.4471 | No | ||
| 17 | IRF6 | 840241 2640139 4050373 6840471 | 11901 | -0.042 | -0.5259 | No | ||
| 18 | SERPINB5 | 6940050 | 12259 | -0.050 | -0.5437 | No | ||
| 19 | NUMB | 2450735 3800253 6350040 | 13320 | -0.081 | -0.5984 | No | ||
| 20 | CTGF | 4540577 | 13902 | -0.107 | -0.6265 | No | ||
| 21 | KLF2 | 6860270 | 14001 | -0.113 | -0.6285 | No | ||
| 22 | SAT1 | 4570463 | 14329 | -0.134 | -0.6422 | No | ||
| 23 | HMMR | 5720315 6380168 | 14620 | -0.159 | -0.6531 | No | ||
| 24 | ATF3 | 1940546 | 14794 | -0.173 | -0.6574 | No | ||
| 25 | CA2 | 1660113 1660600 | 14945 | -0.192 | -0.6598 | No | ||
| 26 | TIMP3 | 1450504 1980270 | 14948 | -0.192 | -0.6543 | No | ||
| 27 | NNT | 540253 1170471 5550092 6760397 | 15268 | -0.233 | -0.6646 | No | ||
| 28 | PLK2 | 6450152 | 15429 | -0.259 | -0.6657 | No | ||
| 29 | EGR2 | 3800403 | 15676 | -0.306 | -0.6700 | No | ||
| 30 | CDH1 | 1940736 | 16513 | -0.532 | -0.6994 | No | ||
| 31 | BCL6 | 940100 | 16836 | -0.649 | -0.6977 | No | ||
| 32 | SGK | 1400131 2480056 | 17743 | -1.100 | -0.7142 | Yes | ||
| 33 | JUP | 2510671 | 17914 | -1.230 | -0.6873 | Yes | ||
| 34 | ITGB5 | 70129 | 17998 | -1.294 | -0.6538 | Yes | ||
| 35 | FLNA | 5390193 | 18128 | -1.422 | -0.6191 | Yes | ||
| 36 | PADI2 | 2940092 6420136 | 18255 | -1.577 | -0.5796 | Yes | ||
| 37 | GRB7 | 2100471 | 18367 | -1.791 | -0.5331 | Yes | ||
| 38 | VAMP8 | 380411 1190139 | 18469 | -2.076 | -0.4776 | Yes | ||
| 39 | ITPR1 | 3450519 | 18470 | -2.077 | -0.4167 | Yes | ||
| 40 | DUSP1 | 6860121 | 18491 | -2.179 | -0.3540 | Yes | ||
| 41 | CTSH | 60524 | 18568 | -2.594 | -0.2820 | Yes | ||
| 42 | TGM2 | 5360452 | 18593 | -3.102 | -0.1923 | Yes | ||
| 43 | PRKCZ | 3780279 | 18595 | -3.117 | -0.1010 | Yes | ||
| 44 | TIAM1 | 5420288 | 18608 | -3.482 | 0.0004 | Yes |