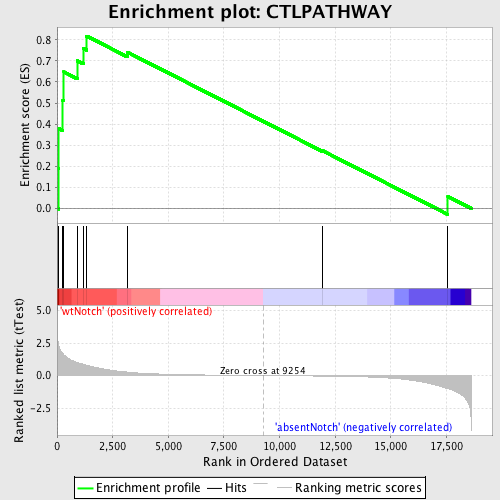
Profile of the Running ES Score & Positions of GeneSet Members on the Rank Ordered List
| Dataset | Set_03_absentNotch_versus_wtNotch.phenotype_absentNotch_versus_wtNotch.cls #wtNotch_versus_absentNotch |
| Phenotype | phenotype_absentNotch_versus_wtNotch.cls#wtNotch_versus_absentNotch |
| Upregulated in class | wtNotch |
| GeneSet | CTLPATHWAY |
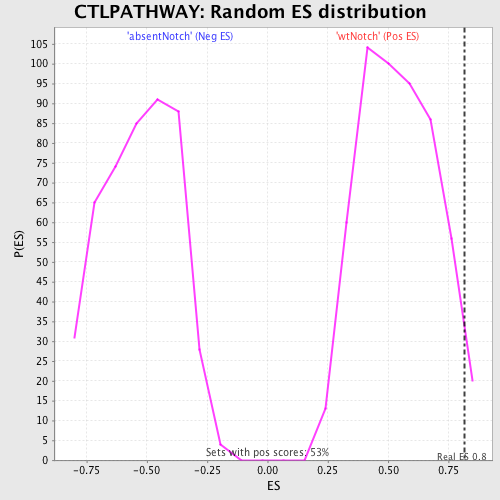
| Enrichment Score (ES) | 0.817731 |
| Normalized Enrichment Score (NES) | 1.5113084 |
| Nominal p-value | 0.02247191 |
| FDR q-value | 0.485915 |
| FWER p-Value | 1.0 |
| PROBE | DESCRIPTION (from dataset) | GENE SYMBOL | GENE_TITLE | RANK IN GENE LIST | RANK METRIC SCORE | RUNNING ES | CORE ENRICHMENT | |
|---|---|---|---|---|---|---|---|---|
| 1 | ICAM1 | 6980138 | 65 | 2.282 | 0.1916 | Yes | ||
| 2 | CD3D | 2810739 | 82 | 2.201 | 0.3789 | Yes | ||
| 3 | CD3G | 2680288 | 255 | 1.692 | 0.5144 | Yes | ||
| 4 | ITGB2 | 6380348 | 303 | 1.590 | 0.6477 | Yes | ||
| 5 | TRB@ | 3940292 | 905 | 1.000 | 0.7009 | Yes | ||
| 6 | ITGAL | 1450324 | 1192 | 0.848 | 0.7581 | Yes | ||
| 7 | CD3E | 3800056 | 1328 | 0.783 | 0.8177 | Yes | ||
| 8 | PRF1 | 6660309 | 3162 | 0.259 | 0.7413 | No | ||
| 9 | GZMB | 380066 | 11924 | -0.042 | 0.2741 | No | ||
| 10 | B2M | 5080332 5130059 | 17565 | -1.000 | 0.0565 | No |