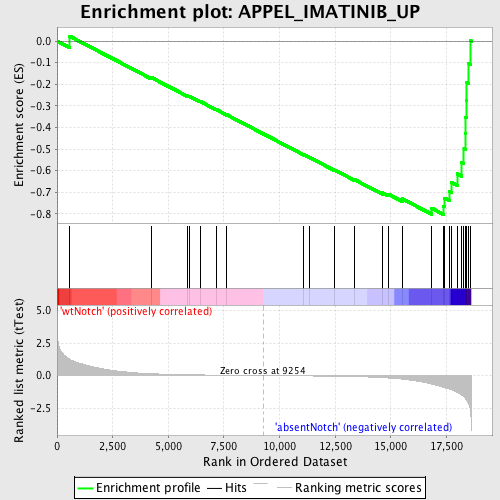
Profile of the Running ES Score & Positions of GeneSet Members on the Rank Ordered List
| Dataset | Set_03_absentNotch_versus_wtNotch.phenotype_absentNotch_versus_wtNotch.cls #wtNotch_versus_absentNotch |
| Phenotype | phenotype_absentNotch_versus_wtNotch.cls#wtNotch_versus_absentNotch |
| Upregulated in class | absentNotch |
| GeneSet | APPEL_IMATINIB_UP |
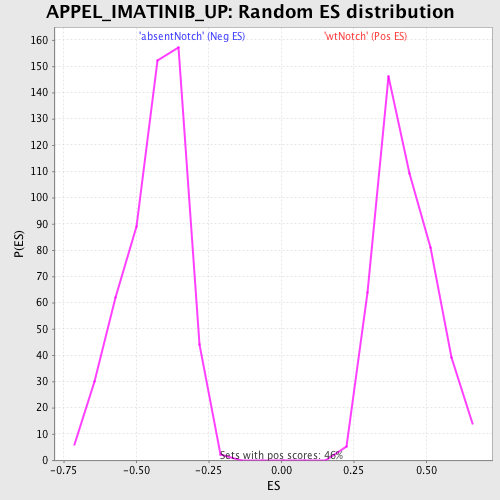
| Enrichment Score (ES) | -0.8031262 |
| Normalized Enrichment Score (NES) | -1.8504968 |
| Nominal p-value | 0.0 |
| FDR q-value | 0.022045666 |
| FWER p-Value | 0.034 |
| PROBE | DESCRIPTION (from dataset) | GENE SYMBOL | GENE_TITLE | RANK IN GENE LIST | RANK METRIC SCORE | RUNNING ES | CORE ENRICHMENT | |
|---|---|---|---|---|---|---|---|---|
| 1 | ACP5 | 2230717 | 556 | 1.257 | 0.0232 | No | ||
| 2 | APOD | 4920441 | 4225 | 0.142 | -0.1681 | No | ||
| 3 | FUCA1 | 610075 | 5868 | 0.062 | -0.2538 | No | ||
| 4 | MSR1 | 940538 | 5935 | 0.060 | -0.2549 | No | ||
| 5 | ENG | 4280270 | 6439 | 0.047 | -0.2799 | No | ||
| 6 | GBA | 2640301 | 7145 | 0.032 | -0.3165 | No | ||
| 7 | CD163 | 2480315 | 7634 | 0.024 | -0.3417 | No | ||
| 8 | HEXB | 5860692 | 11092 | -0.027 | -0.5266 | No | ||
| 9 | C5AR1 | 4540402 | 11364 | -0.031 | -0.5398 | No | ||
| 10 | PLD1 | 2450537 | 12477 | -0.055 | -0.5973 | No | ||
| 11 | OSBPL3 | 3170164 4210196 | 13381 | -0.084 | -0.6424 | No | ||
| 12 | RARRES1 | 770139 5860390 | 14631 | -0.160 | -0.7028 | No | ||
| 13 | GM2A | 430095 | 14888 | -0.185 | -0.7087 | No | ||
| 14 | PPARG | 1990168 2680603 6130632 | 15518 | -0.276 | -0.7309 | No | ||
| 15 | GNS | 3120458 | 16839 | -0.652 | -0.7743 | Yes | ||
| 16 | ASAH1 | 510152 1340484 1740707 | 17375 | -0.905 | -0.7649 | Yes | ||
| 17 | LAMP2 | 1230402 1980373 | 17408 | -0.932 | -0.7272 | Yes | ||
| 18 | PLSCR1 | 2650301 | 17624 | -1.022 | -0.6955 | Yes | ||
| 19 | CTSB | 1400524 2360064 | 17727 | -1.092 | -0.6548 | Yes | ||
| 20 | CTSD | 1070195 | 17981 | -1.275 | -0.6145 | Yes | ||
| 21 | CD68 | 6350450 | 18188 | -1.506 | -0.5619 | Yes | ||
| 22 | CTSZ | 1500687 1690364 | 18288 | -1.634 | -0.4982 | Yes | ||
| 23 | APOC1 | 5900066 6220408 | 18345 | -1.736 | -0.4278 | Yes | ||
| 24 | NEU1 | 380546 | 18360 | -1.780 | -0.3532 | Yes | ||
| 25 | LAMP1 | 2470524 | 18413 | -1.920 | -0.2749 | Yes | ||
| 26 | HEXA | 2630358 | 18420 | -1.931 | -0.1935 | Yes | ||
| 27 | APOE | 4200671 | 18507 | -2.229 | -0.1039 | Yes | ||
| 28 | CTSH | 60524 | 18568 | -2.594 | 0.0026 | Yes |