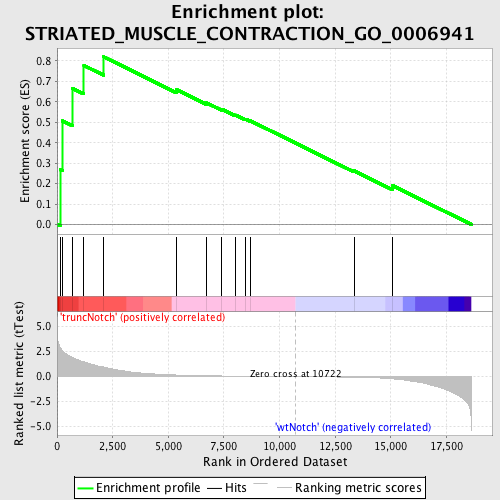
Profile of the Running ES Score & Positions of GeneSet Members on the Rank Ordered List
| Dataset | Set_03_truncNotch_versus_wtNotch.phenotype_truncNotch_versus_wtNotch.cls #truncNotch_versus_wtNotch |
| Phenotype | phenotype_truncNotch_versus_wtNotch.cls#truncNotch_versus_wtNotch |
| Upregulated in class | truncNotch |
| GeneSet | STRIATED_MUSCLE_CONTRACTION_GO_0006941 |
| Enrichment Score (ES) | 0.8202608 |
| Normalized Enrichment Score (NES) | 1.5856962 |
| Nominal p-value | 0.0034843206 |
| FDR q-value | 0.47822046 |
| FWER p-Value | 0.967 |
| PROBE | DESCRIPTION (from dataset) | GENE SYMBOL | GENE_TITLE | RANK IN GENE LIST | RANK METRIC SCORE | RUNNING ES | CORE ENRICHMENT | |
|---|---|---|---|---|---|---|---|---|
| 1 | ALDOA | 6290672 | 137 | 2.907 | 0.2685 | Yes | ||
| 2 | PGAM2 | 3610605 | 248 | 2.574 | 0.5068 | Yes | ||
| 3 | GAA | 520035 | 682 | 1.928 | 0.6665 | Yes | ||
| 4 | SRI | 3390446 4850064 | 1204 | 1.470 | 0.7780 | Yes | ||
| 5 | ATP2A1 | 110309 | 2093 | 0.949 | 0.8203 | Yes | ||
| 6 | MYBPC3 | 650390 | 5365 | 0.160 | 0.6596 | No | ||
| 7 | MYOM1 | 580091 | 6722 | 0.087 | 0.5950 | No | ||
| 8 | SMPX | 6590440 | 7404 | 0.064 | 0.5645 | No | ||
| 9 | MYBPH | 2190711 | 8026 | 0.049 | 0.5357 | No | ||
| 10 | TTN | 2320161 4670056 6550026 | 8471 | 0.039 | 0.5156 | No | ||
| 11 | MYL2 | 70471 | 8686 | 0.035 | 0.5073 | No | ||
| 12 | CASQ2 | 3170136 | 13345 | -0.061 | 0.2628 | No | ||
| 13 | DTNA | 1340600 1780731 2340278 2850132 | 15084 | -0.216 | 0.1899 | No |

