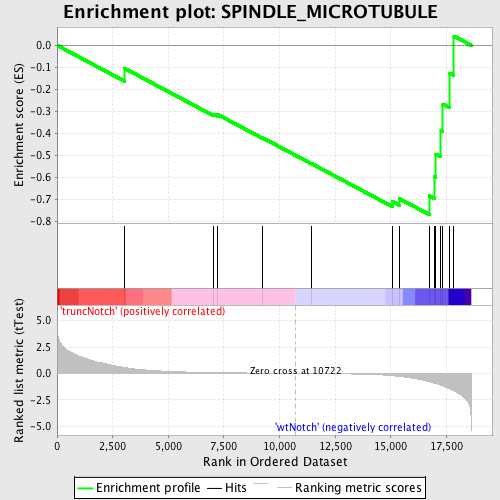
Profile of the Running ES Score & Positions of GeneSet Members on the Rank Ordered List
| Dataset | Set_03_truncNotch_versus_wtNotch.phenotype_truncNotch_versus_wtNotch.cls #truncNotch_versus_wtNotch |
| Phenotype | phenotype_truncNotch_versus_wtNotch.cls#truncNotch_versus_wtNotch |
| Upregulated in class | wtNotch |
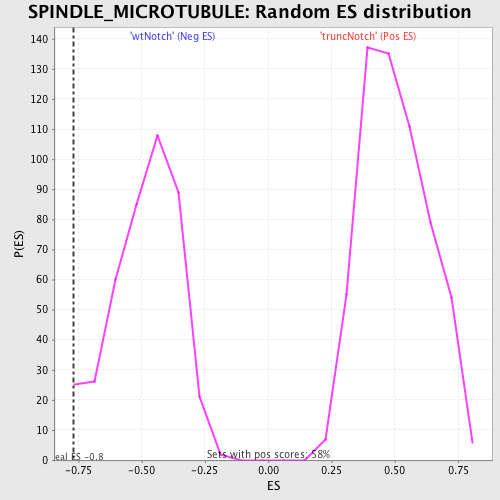
| GeneSet | SPINDLE_MICROTUBULE |
| Enrichment Score (ES) | -0.7674937 |
| Normalized Enrichment Score (NES) | -1.5822265 |
| Nominal p-value | 0.016826924 |
| FDR q-value | 0.32483533 |
| FWER p-Value | 0.995 |
| PROBE | DESCRIPTION (from dataset) | GENE SYMBOL | GENE_TITLE | RANK IN GENE LIST | RANK METRIC SCORE | RUNNING ES | CORE ENRICHMENT | |
|---|---|---|---|---|---|---|---|---|
| 1 | NUMA1 | 6520576 | 3038 | 0.548 | -0.1047 | No | ||
| 2 | TUBGCP3 | 4920563 | 7041 | 0.075 | -0.3118 | No | ||
| 3 | PAFAH1B1 | 4230333 6420121 6450066 | 7219 | 0.070 | -0.3139 | No | ||
| 4 | KIF11 | 5390139 | 9245 | 0.025 | -0.4201 | No | ||
| 5 | CLASP2 | 2510139 | 11412 | -0.011 | -0.5354 | No | ||
| 6 | CLASP1 | 6860279 | 15087 | -0.218 | -0.7096 | Yes | ||
| 7 | TUBG1 | 3140204 | 15374 | -0.280 | -0.6951 | Yes | ||
| 8 | BIRC5 | 110408 580014 1770632 | 16722 | -0.790 | -0.6831 | Yes | ||
| 9 | KNTC1 | 430079 | 16964 | -0.940 | -0.5955 | Yes | ||
| 10 | CDC16 | 1940706 | 17027 | -0.980 | -0.4941 | Yes | ||
| 11 | ZW10 | 2900735 3520687 | 17254 | -1.103 | -0.3884 | Yes | ||
| 12 | POLB | 1400333 | 17337 | -1.175 | -0.2672 | Yes | ||
| 13 | PRC1 | 870092 5890204 | 17654 | -1.472 | -0.1268 | Yes | ||
| 14 | KIF4A | 1410465 4760070 | 17838 | -1.670 | 0.0418 | Yes |