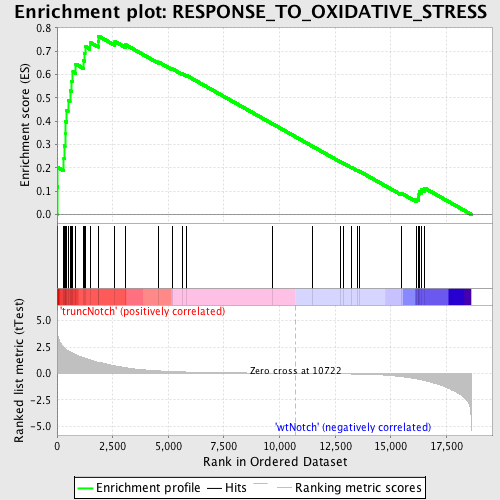
Profile of the Running ES Score & Positions of GeneSet Members on the Rank Ordered List
| Dataset | Set_03_truncNotch_versus_wtNotch.phenotype_truncNotch_versus_wtNotch.cls #truncNotch_versus_wtNotch |
| Phenotype | phenotype_truncNotch_versus_wtNotch.cls#truncNotch_versus_wtNotch |
| Upregulated in class | truncNotch |
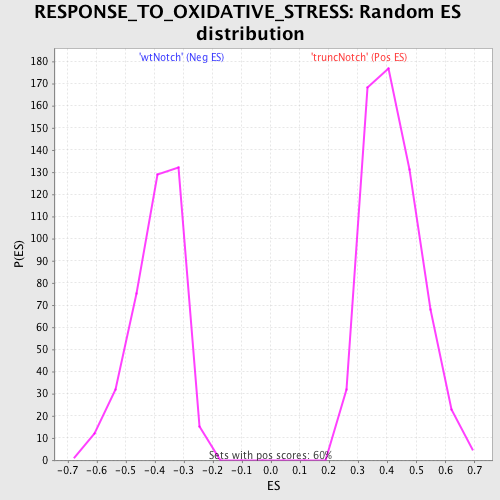
| GeneSet | RESPONSE_TO_OXIDATIVE_STRESS |
| Enrichment Score (ES) | 0.76501834 |
| Normalized Enrichment Score (NES) | 1.82214 |
| Nominal p-value | 0.0 |
| FDR q-value | 0.012104649 |
| FWER p-Value | 0.014 |
| PROBE | DESCRIPTION (from dataset) | GENE SYMBOL | GENE_TITLE | RANK IN GENE LIST | RANK METRIC SCORE | RUNNING ES | CORE ENRICHMENT | |
|---|---|---|---|---|---|---|---|---|
| 1 | ERCC8 | 1240300 6450372 6590180 | 4 | 5.260 | 0.1185 | Yes | ||
| 2 | DUSP1 | 6860121 | 29 | 3.727 | 0.2013 | Yes | ||
| 3 | STK25 | 1090519 1500193 | 305 | 2.438 | 0.2415 | Yes | ||
| 4 | SCARA3 | 5890487 | 327 | 2.403 | 0.2946 | Yes | ||
| 5 | GPX3 | 1340450 | 356 | 2.360 | 0.3464 | Yes | ||
| 6 | PNKP | 4610685 5720605 | 363 | 2.346 | 0.3990 | Yes | ||
| 7 | PDLIM1 | 450100 | 434 | 2.210 | 0.4451 | Yes | ||
| 8 | ERCC1 | 3800010 4590132 4670397 | 493 | 2.149 | 0.4904 | Yes | ||
| 9 | PRDX5 | 1660592 2030091 | 581 | 2.035 | 0.5317 | Yes | ||
| 10 | PRDX2 | 6760095 4010619 5340577 | 660 | 1.957 | 0.5717 | Yes | ||
| 11 | ERCC2 | 2360750 4060390 6550138 | 712 | 1.897 | 0.6117 | Yes | ||
| 12 | NDUFS2 | 4850020 6200402 | 837 | 1.771 | 0.6450 | Yes | ||
| 13 | DHCR24 | 840600 1050672 6290097 | 1178 | 1.483 | 0.6602 | Yes | ||
| 14 | CCL5 | 3710397 | 1229 | 1.453 | 0.6903 | Yes | ||
| 15 | NDUFS8 | 4150100 | 1255 | 1.430 | 0.7212 | Yes | ||
| 16 | GSS | 6130465 6900398 | 1478 | 1.284 | 0.7382 | Yes | ||
| 17 | TXNRD2 | 2510398 3780451 | 1851 | 1.053 | 0.7420 | Yes | ||
| 18 | MPO | 2360176 2760440 5690176 | 1862 | 1.045 | 0.7650 | Yes | ||
| 19 | APTX | 3360041 4560167 | 2599 | 0.722 | 0.7417 | No | ||
| 20 | NUDT1 | 2850600 | 3082 | 0.534 | 0.7278 | No | ||
| 21 | SOD1 | 5890070 | 4554 | 0.237 | 0.6540 | No | ||
| 22 | MSRA | 4570411 | 5182 | 0.175 | 0.6242 | No | ||
| 23 | PRDX6 | 4920397 6380601 | 5616 | 0.142 | 0.6041 | No | ||
| 24 | GLRX2 | 940433 | 5822 | 0.129 | 0.5960 | No | ||
| 25 | SEPP1 | 450273 | 9702 | 0.017 | 0.3876 | No | ||
| 26 | SGK2 | 1850070 | 11460 | -0.012 | 0.2933 | No | ||
| 27 | SRXN1 | 630731 3130195 4480239 | 12739 | -0.040 | 0.2254 | No | ||
| 28 | ATOX1 | 1090497 | 12851 | -0.043 | 0.2204 | No | ||
| 29 | APOA4 | 4120451 | 13214 | -0.056 | 0.2022 | No | ||
| 30 | GCLC | 2810731 | 13481 | -0.067 | 0.1893 | No | ||
| 31 | NDUFB4 | 460348 5690594 | 13596 | -0.072 | 0.1848 | No | ||
| 32 | RNF7 | 2030242 | 15465 | -0.298 | 0.0910 | No | ||
| 33 | NDUFA6 | 3990348 | 16148 | -0.517 | 0.0660 | No | ||
| 34 | ERCC3 | 6900008 | 16234 | -0.551 | 0.0738 | No | ||
| 35 | SOD2 | 1410053 | 16262 | -0.560 | 0.0850 | No | ||
| 36 | PRNP | 3140687 | 16270 | -0.563 | 0.0973 | No | ||
| 37 | GCLM | 4230270 | 16375 | -0.605 | 0.1054 | No | ||
| 38 | CYGB | 870347 | 16519 | -0.672 | 0.1129 | No |