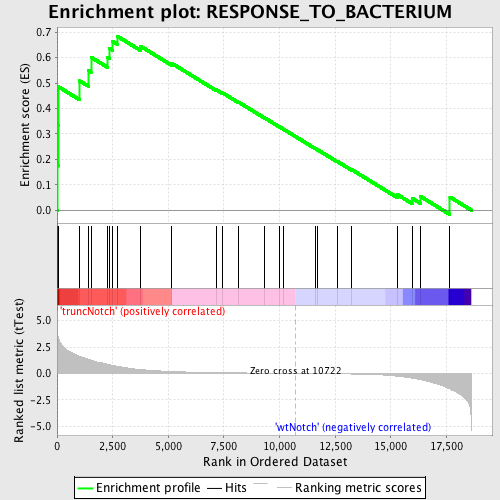
Profile of the Running ES Score & Positions of GeneSet Members on the Rank Ordered List
| Dataset | Set_03_truncNotch_versus_wtNotch.phenotype_truncNotch_versus_wtNotch.cls #truncNotch_versus_wtNotch |
| Phenotype | phenotype_truncNotch_versus_wtNotch.cls#truncNotch_versus_wtNotch |
| Upregulated in class | truncNotch |
| GeneSet | RESPONSE_TO_BACTERIUM |
| Enrichment Score (ES) | 0.68458194 |
| Normalized Enrichment Score (NES) | 1.5305841 |
| Nominal p-value | 0.016806724 |
| FDR q-value | 0.54109204 |
| FWER p-Value | 1.0 |
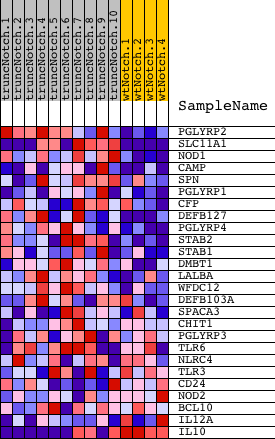
| PROBE | DESCRIPTION (from dataset) | GENE SYMBOL | GENE_TITLE | RANK IN GENE LIST | RANK METRIC SCORE | RUNNING ES | CORE ENRICHMENT | |
|---|---|---|---|---|---|---|---|---|
| 1 | PGLYRP2 | 2340086 | 27 | 3.791 | 0.1749 | Yes | ||
| 2 | SLC11A1 | 940286 2810435 6370647 | 51 | 3.418 | 0.3327 | Yes | ||
| 3 | NOD1 | 2360368 | 66 | 3.288 | 0.4849 | Yes | ||
| 4 | CAMP | 6290735 | 1017 | 1.602 | 0.5083 | Yes | ||
| 5 | SPN | 3520338 3870671 | 1408 | 1.335 | 0.5495 | Yes | ||
| 6 | PGLYRP1 | 6760242 | 1527 | 1.254 | 0.6014 | Yes | ||
| 7 | CFP | 2100619 | 2274 | 0.868 | 0.6017 | Yes | ||
| 8 | DEFB127 | 520564 | 2351 | 0.830 | 0.6362 | Yes | ||
| 9 | PGLYRP4 | 3780411 | 2506 | 0.763 | 0.6634 | Yes | ||
| 10 | STAB2 | 4810452 | 2698 | 0.676 | 0.6846 | Yes | ||
| 11 | STAB1 | 5390707 | 3742 | 0.364 | 0.6454 | No | ||
| 12 | DMBT1 | 7050270 | 5148 | 0.178 | 0.5781 | No | ||
| 13 | LALBA | 6940685 | 7146 | 0.072 | 0.4741 | No | ||
| 14 | WFDC12 | 6980647 | 7432 | 0.063 | 0.4617 | No | ||
| 15 | DEFB103A | 50014 | 8173 | 0.045 | 0.4240 | No | ||
| 16 | SPACA3 | 1850161 | 9329 | 0.023 | 0.3629 | No | ||
| 17 | CHIT1 | 7050347 | 9992 | 0.012 | 0.3279 | No | ||
| 18 | PGLYRP3 | 6350403 | 10161 | 0.009 | 0.3193 | No | ||
| 19 | TLR6 | 510102 3390148 | 11610 | -0.015 | 0.2421 | No | ||
| 20 | NLRC4 | 5570332 | 11718 | -0.017 | 0.2371 | No | ||
| 21 | TLR3 | 6760451 | 12583 | -0.036 | 0.1923 | No | ||
| 22 | CD24 | 1780091 | 13244 | -0.057 | 0.1595 | No | ||
| 23 | NOD2 | 2510050 | 15292 | -0.261 | 0.0615 | No | ||
| 24 | BCL10 | 2360397 | 15955 | -0.455 | 0.0470 | No | ||
| 25 | IL12A | 7100551 | 16333 | -0.588 | 0.0541 | No | ||
| 26 | IL10 | 2340685 2640541 2850403 6590286 | 17657 | -1.475 | 0.0516 | No |