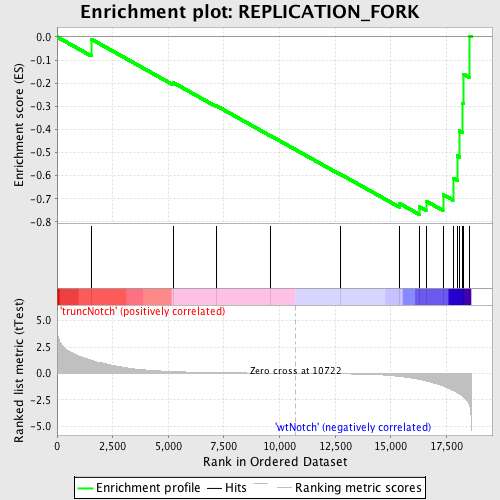
Profile of the Running ES Score & Positions of GeneSet Members on the Rank Ordered List
| Dataset | Set_03_truncNotch_versus_wtNotch.phenotype_truncNotch_versus_wtNotch.cls #truncNotch_versus_wtNotch |
| Phenotype | phenotype_truncNotch_versus_wtNotch.cls#truncNotch_versus_wtNotch |
| Upregulated in class | wtNotch |
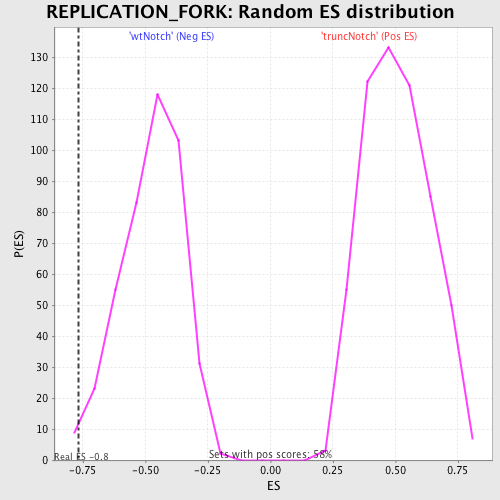
| GeneSet | REPLICATION_FORK |
| Enrichment Score (ES) | -0.7678692 |
| Normalized Enrichment Score (NES) | -1.6117164 |
| Nominal p-value | 0.016509434 |
| FDR q-value | 0.28439686 |
| FWER p-Value | 0.973 |
| PROBE | DESCRIPTION (from dataset) | GENE SYMBOL | GENE_TITLE | RANK IN GENE LIST | RANK METRIC SCORE | RUNNING ES | CORE ENRICHMENT | |
|---|---|---|---|---|---|---|---|---|
| 1 | RFC5 | 3800452 6020091 | 1531 | 1.251 | -0.0094 | No | ||
| 2 | MCM3 | 5570068 | 5213 | 0.172 | -0.1972 | No | ||
| 3 | RFC3 | 1980600 | 7145 | 0.072 | -0.2968 | No | ||
| 4 | POLA1 | 4760541 | 9609 | 0.018 | -0.4281 | No | ||
| 5 | PURA | 3870156 | 12716 | -0.040 | -0.5928 | No | ||
| 6 | RPA2 | 2760301 5420195 | 15395 | -0.283 | -0.7202 | No | ||
| 7 | MCM7 | 3290292 5220056 | 16282 | -0.569 | -0.7347 | Yes | ||
| 8 | PURB | 5360138 | 16587 | -0.701 | -0.7101 | Yes | ||
| 9 | CDT1 | 3780682 | 17348 | -1.186 | -0.6818 | Yes | ||
| 10 | RPA3 | 5700136 | 17795 | -1.631 | -0.6106 | Yes | ||
| 11 | RFC1 | 1190673 | 17986 | -1.828 | -0.5142 | Yes | ||
| 12 | PCNA | 940754 | 18090 | -1.941 | -0.4066 | Yes | ||
| 13 | RPA1 | 360452 | 18231 | -2.159 | -0.2881 | Yes | ||
| 14 | BCL6 | 940100 | 18261 | -2.213 | -0.1607 | Yes | ||
| 15 | RFC4 | 3800082 6840142 | 18552 | -3.081 | 0.0034 | Yes |