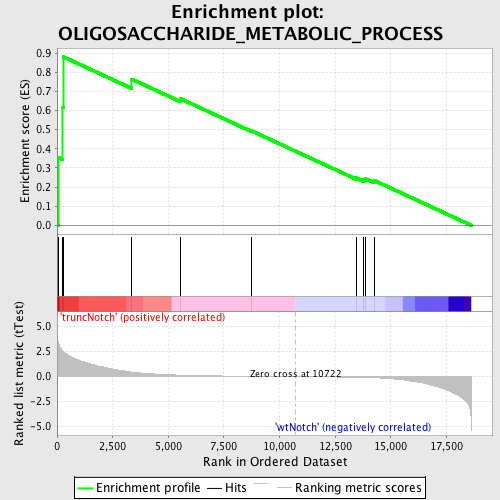
Profile of the Running ES Score & Positions of GeneSet Members on the Rank Ordered List
| Dataset | Set_03_truncNotch_versus_wtNotch.phenotype_truncNotch_versus_wtNotch.cls #truncNotch_versus_wtNotch |
| Phenotype | phenotype_truncNotch_versus_wtNotch.cls#truncNotch_versus_wtNotch |
| Upregulated in class | truncNotch |
| GeneSet | OLIGOSACCHARIDE_METABOLIC_PROCESS |
| Enrichment Score (ES) | 0.8798909 |
| Normalized Enrichment Score (NES) | 1.6026193 |
| Nominal p-value | 0.0017921147 |
| FDR q-value | 0.72696596 |
| FWER p-Value | 0.916 |
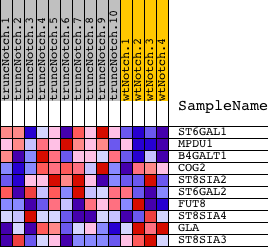
| PROBE | DESCRIPTION (from dataset) | GENE SYMBOL | GENE_TITLE | RANK IN GENE LIST | RANK METRIC SCORE | RUNNING ES | CORE ENRICHMENT | |
|---|---|---|---|---|---|---|---|---|
| 1 | ST6GAL1 | 2970546 | 59 | 3.317 | 0.3534 | Yes | ||
| 2 | MPDU1 | 1850091 | 260 | 2.528 | 0.6143 | Yes | ||
| 3 | B4GALT1 | 6980167 | 284 | 2.483 | 0.8799 | Yes | ||
| 4 | COG2 | 5900129 | 3351 | 0.451 | 0.7636 | No | ||
| 5 | ST8SIA2 | 2680082 | 5540 | 0.147 | 0.6618 | No | ||
| 6 | ST6GAL2 | 1170739 | 8747 | 0.033 | 0.4931 | No | ||
| 7 | FUT8 | 1340068 2340056 | 13436 | -0.065 | 0.2481 | No | ||
| 8 | ST8SIA4 | 2680605 3060215 | 13771 | -0.080 | 0.2388 | No | ||
| 9 | GLA | 4610364 | 13872 | -0.086 | 0.2427 | No | ||
| 10 | ST8SIA3 | 6940427 | 14259 | -0.114 | 0.2342 | No |