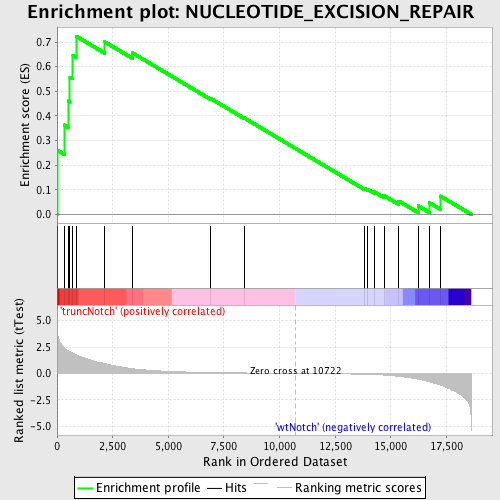
Profile of the Running ES Score & Positions of GeneSet Members on the Rank Ordered List
| Dataset | Set_03_truncNotch_versus_wtNotch.phenotype_truncNotch_versus_wtNotch.cls #truncNotch_versus_wtNotch |
| Phenotype | phenotype_truncNotch_versus_wtNotch.cls#truncNotch_versus_wtNotch |
| Upregulated in class | truncNotch |
| GeneSet | NUCLEOTIDE_EXCISION_REPAIR |
| Enrichment Score (ES) | 0.7242491 |
| Normalized Enrichment Score (NES) | 1.4726833 |
| Nominal p-value | 0.02749141 |
| FDR q-value | 0.6716583 |
| FWER p-Value | 1.0 |
| PROBE | DESCRIPTION (from dataset) | GENE SYMBOL | GENE_TITLE | RANK IN GENE LIST | RANK METRIC SCORE | RUNNING ES | CORE ENRICHMENT | |
|---|---|---|---|---|---|---|---|---|
| 1 | ERCC8 | 1240300 6450372 6590180 | 4 | 5.260 | 0.2609 | Yes | ||
| 2 | POLL | 5910673 6350672 | 323 | 2.408 | 0.3633 | Yes | ||
| 3 | ERCC1 | 3800010 4590132 4670397 | 493 | 2.149 | 0.4609 | Yes | ||
| 4 | NTHL1 | 4920148 | 576 | 2.039 | 0.5577 | Yes | ||
| 5 | ERCC2 | 2360750 4060390 6550138 | 712 | 1.897 | 0.6446 | Yes | ||
| 6 | XAB2 | 60110 | 850 | 1.753 | 0.7242 | Yes | ||
| 7 | DDB1 | 6110687 | 2145 | 0.927 | 0.7007 | No | ||
| 8 | TP53 | 6130707 | 3380 | 0.442 | 0.6563 | No | ||
| 9 | XPC | 6370193 | 6913 | 0.079 | 0.4703 | No | ||
| 10 | RAD23A | 670082 5270309 5360463 5550364 | 8408 | 0.040 | 0.3920 | No | ||
| 11 | RAD23B | 2190671 | 13794 | -0.082 | 0.1065 | No | ||
| 12 | DDB2 | 3520341 4610168 4850184 4920717 | 13962 | -0.092 | 0.1021 | No | ||
| 13 | ATXN3 | 50156 2900095 | 14267 | -0.114 | 0.0914 | No | ||
| 14 | ERCC5 | 770025 4540692 | 14707 | -0.158 | 0.0756 | No | ||
| 15 | BRCA2 | 4280372 | 15357 | -0.274 | 0.0544 | No | ||
| 16 | ERCC3 | 6900008 | 16234 | -0.551 | 0.0346 | No | ||
| 17 | LIG4 | 6660035 | 16743 | -0.802 | 0.0471 | No | ||
| 18 | ERCC4 | 1570619 5720180 | 17223 | -1.079 | 0.0749 | No |

