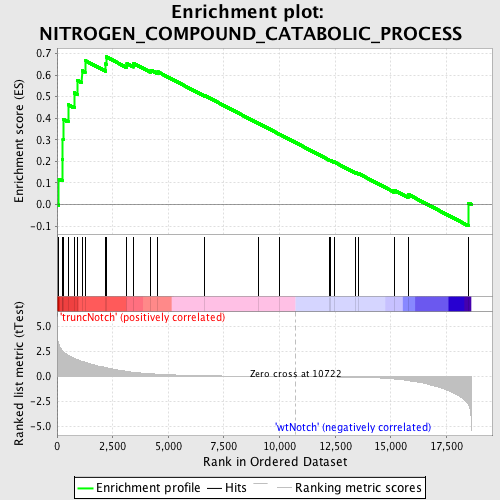
Profile of the Running ES Score & Positions of GeneSet Members on the Rank Ordered List
| Dataset | Set_03_truncNotch_versus_wtNotch.phenotype_truncNotch_versus_wtNotch.cls #truncNotch_versus_wtNotch |
| Phenotype | phenotype_truncNotch_versus_wtNotch.cls#truncNotch_versus_wtNotch |
| Upregulated in class | truncNotch |
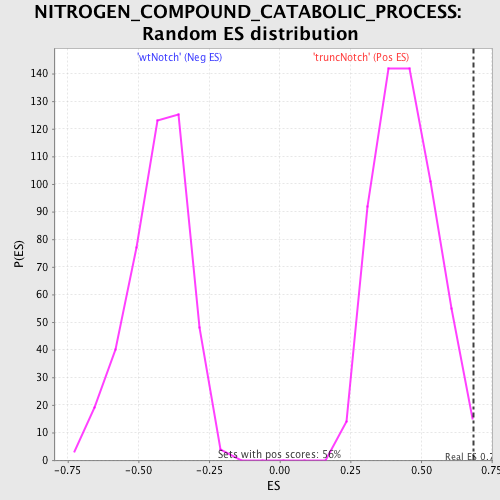
| GeneSet | NITROGEN_COMPOUND_CATABOLIC_PROCESS |
| Enrichment Score (ES) | 0.684114 |
| Normalized Enrichment Score (NES) | 1.5432144 |
| Nominal p-value | 0.010695187 |
| FDR q-value | 0.60318595 |
| FWER p-Value | 1.0 |
| PROBE | DESCRIPTION (from dataset) | GENE SYMBOL | GENE_TITLE | RANK IN GENE LIST | RANK METRIC SCORE | RUNNING ES | CORE ENRICHMENT | |
|---|---|---|---|---|---|---|---|---|
| 1 | MPST | 6380373 | 72 | 3.240 | 0.1181 | Yes | ||
| 2 | GSTZ1 | 7000451 | 233 | 2.608 | 0.2077 | Yes | ||
| 3 | BCKDHA | 50189 | 262 | 2.526 | 0.3013 | Yes | ||
| 4 | DHPS | 5340735 | 281 | 2.486 | 0.3939 | Yes | ||
| 5 | GOT1 | 2940465 | 498 | 2.138 | 0.4628 | Yes | ||
| 6 | TST | 730372 | 772 | 1.841 | 0.5174 | Yes | ||
| 7 | ALDH4A1 | 2450450 | 902 | 1.712 | 0.5749 | Yes | ||
| 8 | FAH | 5390195 | 1118 | 1.525 | 0.6208 | Yes | ||
| 9 | BCKDK | 1940601 3990600 | 1258 | 1.428 | 0.6671 | Yes | ||
| 10 | GOT2 | 4570164 5220450 | 2186 | 0.906 | 0.6513 | Yes | ||
| 11 | BCKDHB | 780372 | 2206 | 0.898 | 0.6841 | Yes | ||
| 12 | MCCC2 | 6110168 | 3138 | 0.515 | 0.6534 | No | ||
| 13 | ASL | 1240601 5340309 5360082 | 3444 | 0.429 | 0.6532 | No | ||
| 14 | AMT | 3180450 | 4216 | 0.282 | 0.6223 | No | ||
| 15 | GAD1 | 2360035 3140167 | 4529 | 0.240 | 0.6146 | No | ||
| 16 | DDAH2 | 4480551 | 6632 | 0.090 | 0.5049 | No | ||
| 17 | ASPA | 3290400 | 9038 | 0.028 | 0.3766 | No | ||
| 18 | DDAH1 | 6400750 | 10014 | 0.012 | 0.3246 | No | ||
| 19 | GAD2 | 1400088 | 12255 | -0.028 | 0.2052 | No | ||
| 20 | HPD | 3120519 | 12293 | -0.029 | 0.2043 | No | ||
| 21 | INDO | 2680390 | 12446 | -0.033 | 0.1973 | No | ||
| 22 | HGD | 460390 | 13411 | -0.064 | 0.1479 | No | ||
| 23 | GLDC | 1170324 | 13543 | -0.070 | 0.1434 | No | ||
| 24 | ASRGL1 | 6620278 | 15149 | -0.231 | 0.0658 | No | ||
| 25 | ARG1 | 840707 | 15778 | -0.392 | 0.0468 | No | ||
| 26 | GLUD1 | 4210372 | 18499 | -2.811 | 0.0063 | No |