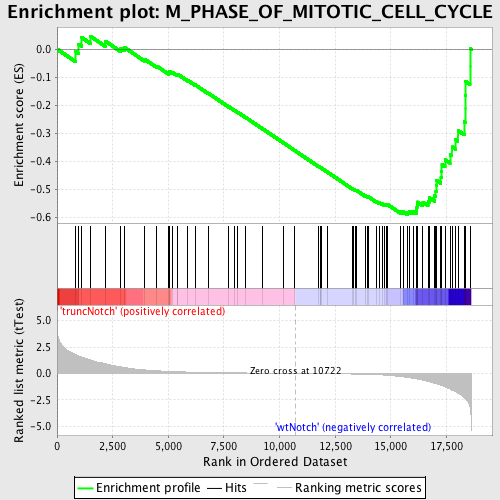
Profile of the Running ES Score & Positions of GeneSet Members on the Rank Ordered List
| Dataset | Set_03_truncNotch_versus_wtNotch.phenotype_truncNotch_versus_wtNotch.cls #truncNotch_versus_wtNotch |
| Phenotype | phenotype_truncNotch_versus_wtNotch.cls#truncNotch_versus_wtNotch |
| Upregulated in class | wtNotch |
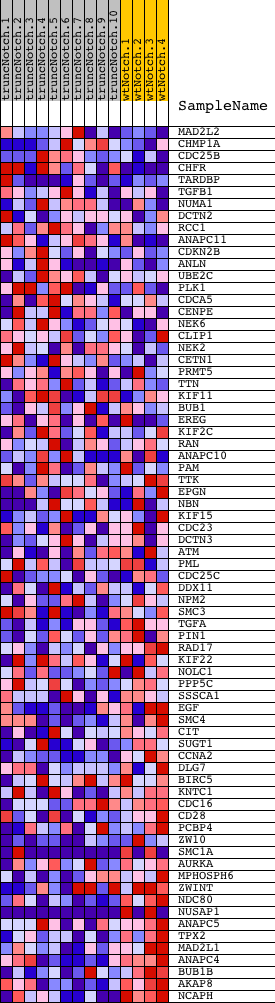
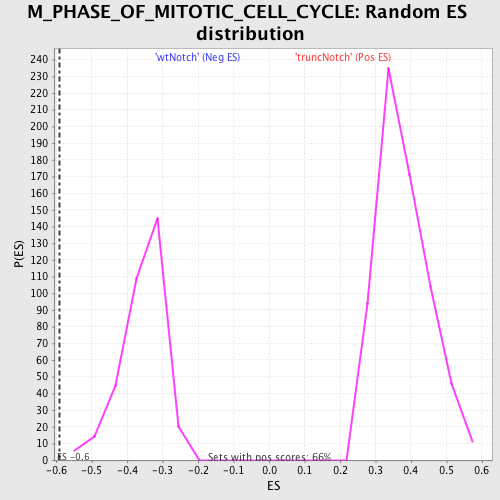
| GeneSet | M_PHASE_OF_MITOTIC_CELL_CYCLE |
| Enrichment Score (ES) | -0.5896332 |
| Normalized Enrichment Score (NES) | -1.6514019 |
| Nominal p-value | 0.0 |
| FDR q-value | 0.24749586 |
| FWER p-Value | 0.873 |
| PROBE | DESCRIPTION (from dataset) | GENE SYMBOL | GENE_TITLE | RANK IN GENE LIST | RANK METRIC SCORE | RUNNING ES | CORE ENRICHMENT | |
|---|---|---|---|---|---|---|---|---|
| 1 | MAD2L2 | 1240358 | 828 | 1.784 | -0.0084 | No | ||
| 2 | CHMP1A | 5550441 | 965 | 1.647 | 0.0178 | No | ||
| 3 | CDC25B | 6940102 | 1097 | 1.538 | 0.0420 | No | ||
| 4 | CHFR | 3390050 6450300 6450736 | 1489 | 1.272 | 0.0467 | No | ||
| 5 | TARDBP | 870390 2350093 | 2164 | 0.917 | 0.0290 | No | ||
| 6 | TGFB1 | 1940162 | 2867 | 0.610 | 0.0036 | No | ||
| 7 | NUMA1 | 6520576 | 3038 | 0.548 | 0.0055 | No | ||
| 8 | DCTN2 | 540471 3780717 | 3928 | 0.333 | -0.0356 | No | ||
| 9 | RCC1 | 2480358 | 4488 | 0.246 | -0.0608 | No | ||
| 10 | ANAPC11 | 1780601 | 5028 | 0.189 | -0.0860 | No | ||
| 11 | CDKN2B | 6020040 | 5044 | 0.187 | -0.0830 | No | ||
| 12 | ANLN | 1780113 2470537 6840047 | 5049 | 0.187 | -0.0794 | No | ||
| 13 | UBE2C | 6130017 | 5204 | 0.173 | -0.0842 | No | ||
| 14 | PLK1 | 1780369 2640121 | 5389 | 0.159 | -0.0909 | No | ||
| 15 | CDCA5 | 5670131 | 5416 | 0.156 | -0.0892 | No | ||
| 16 | CENPE | 2850022 | 5869 | 0.126 | -0.1110 | No | ||
| 17 | NEK6 | 3360687 | 6197 | 0.109 | -0.1264 | No | ||
| 18 | CLIP1 | 2850162 6770397 | 6789 | 0.084 | -0.1565 | No | ||
| 19 | NEK2 | 2120520 | 7723 | 0.056 | -0.2057 | No | ||
| 20 | CETN1 | 6020056 | 7956 | 0.050 | -0.2172 | No | ||
| 21 | PRMT5 | 2760180 4590072 | 8107 | 0.047 | -0.2244 | No | ||
| 22 | TTN | 2320161 4670056 6550026 | 8471 | 0.039 | -0.2431 | No | ||
| 23 | KIF11 | 5390139 | 9245 | 0.025 | -0.2843 | No | ||
| 24 | BUB1 | 5390270 | 10159 | 0.009 | -0.3334 | No | ||
| 25 | EREG | 50519 4920129 | 10683 | 0.001 | -0.3616 | No | ||
| 26 | KIF2C | 6940082 | 11750 | -0.018 | -0.4187 | No | ||
| 27 | RAN | 2260446 4590647 | 11827 | -0.019 | -0.4224 | No | ||
| 28 | ANAPC10 | 870086 1170037 2260129 | 11843 | -0.019 | -0.4228 | No | ||
| 29 | PAM | 5290528 | 11865 | -0.020 | -0.4235 | No | ||
| 30 | TTK | 3800129 | 12149 | -0.026 | -0.4383 | No | ||
| 31 | EPGN | 6980450 | 13283 | -0.059 | -0.4982 | No | ||
| 32 | NBN | 730538 2470619 4780594 | 13322 | -0.060 | -0.4990 | No | ||
| 33 | KIF15 | 610731 4070731 6520014 | 13416 | -0.064 | -0.5027 | No | ||
| 34 | CDC23 | 3190593 | 13459 | -0.066 | -0.5036 | No | ||
| 35 | DCTN3 | 6840131 | 13849 | -0.085 | -0.5229 | No | ||
| 36 | ATM | 3610110 4050524 | 13930 | -0.090 | -0.5254 | No | ||
| 37 | PML | 50093 2190435 2450402 3840082 | 13983 | -0.093 | -0.5263 | No | ||
| 38 | CDC25C | 2570673 4760161 6520707 | 14375 | -0.124 | -0.5448 | No | ||
| 39 | DDX11 | 6590671 | 14481 | -0.133 | -0.5478 | No | ||
| 40 | NPM2 | 6040139 | 14613 | -0.148 | -0.5518 | No | ||
| 41 | SMC3 | 870546 1400411 5700039 6450577 | 14706 | -0.158 | -0.5536 | No | ||
| 42 | TGFA | 1570332 | 14796 | -0.172 | -0.5549 | No | ||
| 43 | PIN1 | 2970408 | 14858 | -0.180 | -0.5545 | No | ||
| 44 | RAD17 | 5220739 | 15422 | -0.288 | -0.5791 | No | ||
| 45 | KIF22 | 1190368 | 15549 | -0.321 | -0.5793 | No | ||
| 46 | NOLC1 | 2350195 | 15741 | -0.381 | -0.5819 | Yes | ||
| 47 | PPP5C | 3130047 | 15821 | -0.409 | -0.5778 | Yes | ||
| 48 | SSSCA1 | 1240402 780309 | 16008 | -0.469 | -0.5783 | Yes | ||
| 49 | EGF | 5220154 | 16142 | -0.515 | -0.5750 | Yes | ||
| 50 | SMC4 | 5910240 | 16168 | -0.524 | -0.5657 | Yes | ||
| 51 | CIT | 2370601 | 16181 | -0.528 | -0.5557 | Yes | ||
| 52 | SUGT1 | 1690670 | 16186 | -0.532 | -0.5451 | Yes | ||
| 53 | CCNA2 | 5290075 | 16440 | -0.634 | -0.5458 | Yes | ||
| 54 | DLG7 | 3120041 | 16674 | -0.763 | -0.5429 | Yes | ||
| 55 | BIRC5 | 110408 580014 1770632 | 16722 | -0.790 | -0.5294 | Yes | ||
| 56 | KNTC1 | 430079 | 16964 | -0.940 | -0.5232 | Yes | ||
| 57 | CDC16 | 1940706 | 17027 | -0.980 | -0.5067 | Yes | ||
| 58 | CD28 | 1400739 4210093 | 17038 | -0.983 | -0.4872 | Yes | ||
| 59 | PCBP4 | 6350722 | 17053 | -0.991 | -0.4678 | Yes | ||
| 60 | ZW10 | 2900735 3520687 | 17254 | -1.103 | -0.4562 | Yes | ||
| 61 | SMC1A | 3060600 5700148 5890113 6370154 | 17283 | -1.130 | -0.4347 | Yes | ||
| 62 | AURKA | 780537 | 17299 | -1.140 | -0.4124 | Yes | ||
| 63 | MPHOSPH6 | 5570164 | 17437 | -1.259 | -0.3942 | Yes | ||
| 64 | ZWINT | 6940670 | 17662 | -1.481 | -0.3762 | Yes | ||
| 65 | NDC80 | 4120465 | 17749 | -1.583 | -0.3486 | Yes | ||
| 66 | NUSAP1 | 940048 3120435 | 17902 | -1.733 | -0.3216 | Yes | ||
| 67 | ANAPC5 | 730164 7100685 | 18019 | -1.862 | -0.2900 | Yes | ||
| 68 | TPX2 | 6420324 | 18310 | -2.306 | -0.2588 | Yes | ||
| 69 | MAD2L1 | 4480725 | 18343 | -2.379 | -0.2122 | Yes | ||
| 70 | ANAPC4 | 4540338 | 18344 | -2.384 | -0.1637 | Yes | ||
| 71 | BUB1B | 1450288 | 18355 | -2.413 | -0.1152 | Yes | ||
| 72 | AKAP8 | 4210026 | 18559 | -3.171 | -0.0617 | Yes | ||
| 73 | NCAPH | 6220435 | 18560 | -3.183 | 0.0030 | Yes |