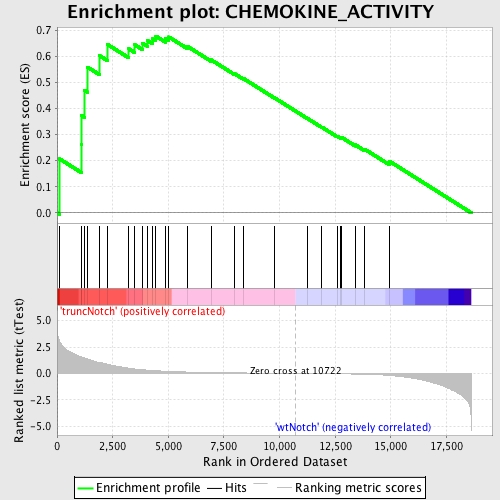
Profile of the Running ES Score & Positions of GeneSet Members on the Rank Ordered List
| Dataset | Set_03_truncNotch_versus_wtNotch.phenotype_truncNotch_versus_wtNotch.cls #truncNotch_versus_wtNotch |
| Phenotype | phenotype_truncNotch_versus_wtNotch.cls#truncNotch_versus_wtNotch |
| Upregulated in class | truncNotch |
| GeneSet | CHEMOKINE_ACTIVITY |
| Enrichment Score (ES) | 0.67687386 |
| Normalized Enrichment Score (NES) | 1.5228478 |
| Nominal p-value | 0.02746365 |
| FDR q-value | 0.5572945 |
| FWER p-Value | 1.0 |
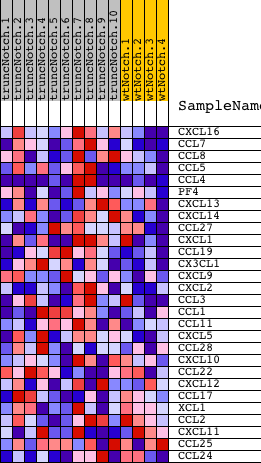
| PROBE | DESCRIPTION (from dataset) | GENE SYMBOL | GENE_TITLE | RANK IN GENE LIST | RANK METRIC SCORE | RUNNING ES | CORE ENRICHMENT | |
|---|---|---|---|---|---|---|---|---|
| 1 | CXCL16 | 510278 | 114 | 2.989 | 0.2067 | Yes | ||
| 2 | CCL7 | 2650519 | 1093 | 1.539 | 0.2636 | Yes | ||
| 3 | CCL8 | 3870010 | 1101 | 1.535 | 0.3725 | Yes | ||
| 4 | CCL5 | 3710397 | 1229 | 1.453 | 0.4692 | Yes | ||
| 5 | CCL4 | 50368 430047 | 1374 | 1.353 | 0.5577 | Yes | ||
| 6 | PF4 | 6130332 | 1910 | 1.023 | 0.6018 | Yes | ||
| 7 | CXCL13 | 6290402 | 2261 | 0.873 | 0.6452 | Yes | ||
| 8 | CXCL14 | 840114 6450324 | 3223 | 0.488 | 0.6282 | Yes | ||
| 9 | CCL27 | 2120070 | 3492 | 0.418 | 0.6436 | Yes | ||
| 10 | CXCL1 | 2690537 | 3826 | 0.349 | 0.6505 | Yes | ||
| 11 | CCL19 | 5080487 | 4076 | 0.306 | 0.6589 | Yes | ||
| 12 | CX3CL1 | 3990707 | 4299 | 0.272 | 0.6663 | Yes | ||
| 13 | CXCL9 | 1570673 | 4438 | 0.253 | 0.6769 | Yes | ||
| 14 | CXCL2 | 610398 | 4866 | 0.205 | 0.6685 | No | ||
| 15 | CCL3 | 2810092 | 5023 | 0.190 | 0.6736 | No | ||
| 16 | CCL1 | 4230167 | 5871 | 0.126 | 0.6370 | No | ||
| 17 | CCL11 | 1770347 | 6929 | 0.079 | 0.5858 | No | ||
| 18 | CXCL5 | 6370333 | 7983 | 0.050 | 0.5327 | No | ||
| 19 | CCL28 | 2690593 | 8384 | 0.041 | 0.5140 | No | ||
| 20 | CXCL10 | 2450408 | 9764 | 0.016 | 0.4410 | No | ||
| 21 | CCL22 | 6380086 | 11269 | -0.009 | 0.3607 | No | ||
| 22 | CXCL12 | 580546 4150750 4570068 | 11898 | -0.020 | 0.3284 | No | ||
| 23 | CCL17 | 630121 | 12600 | -0.036 | 0.2932 | No | ||
| 24 | XCL1 | 3800504 | 12757 | -0.041 | 0.2878 | No | ||
| 25 | CCL2 | 4760019 | 12785 | -0.042 | 0.2893 | No | ||
| 26 | CXCL11 | 1090551 | 13406 | -0.063 | 0.2604 | No | ||
| 27 | CCL25 | 450541 540435 | 13832 | -0.084 | 0.2435 | No | ||
| 28 | CCL24 | 670129 | 14946 | -0.193 | 0.1974 | No |